Personal projects / Sensors & electronics
Water-quality monitoring
Optical instruments that compare the light transmitted through water samples, from bench prototypes to a radio-connected river deployment.
Open the numbered review →River-deployed monitor
Photos 100–105
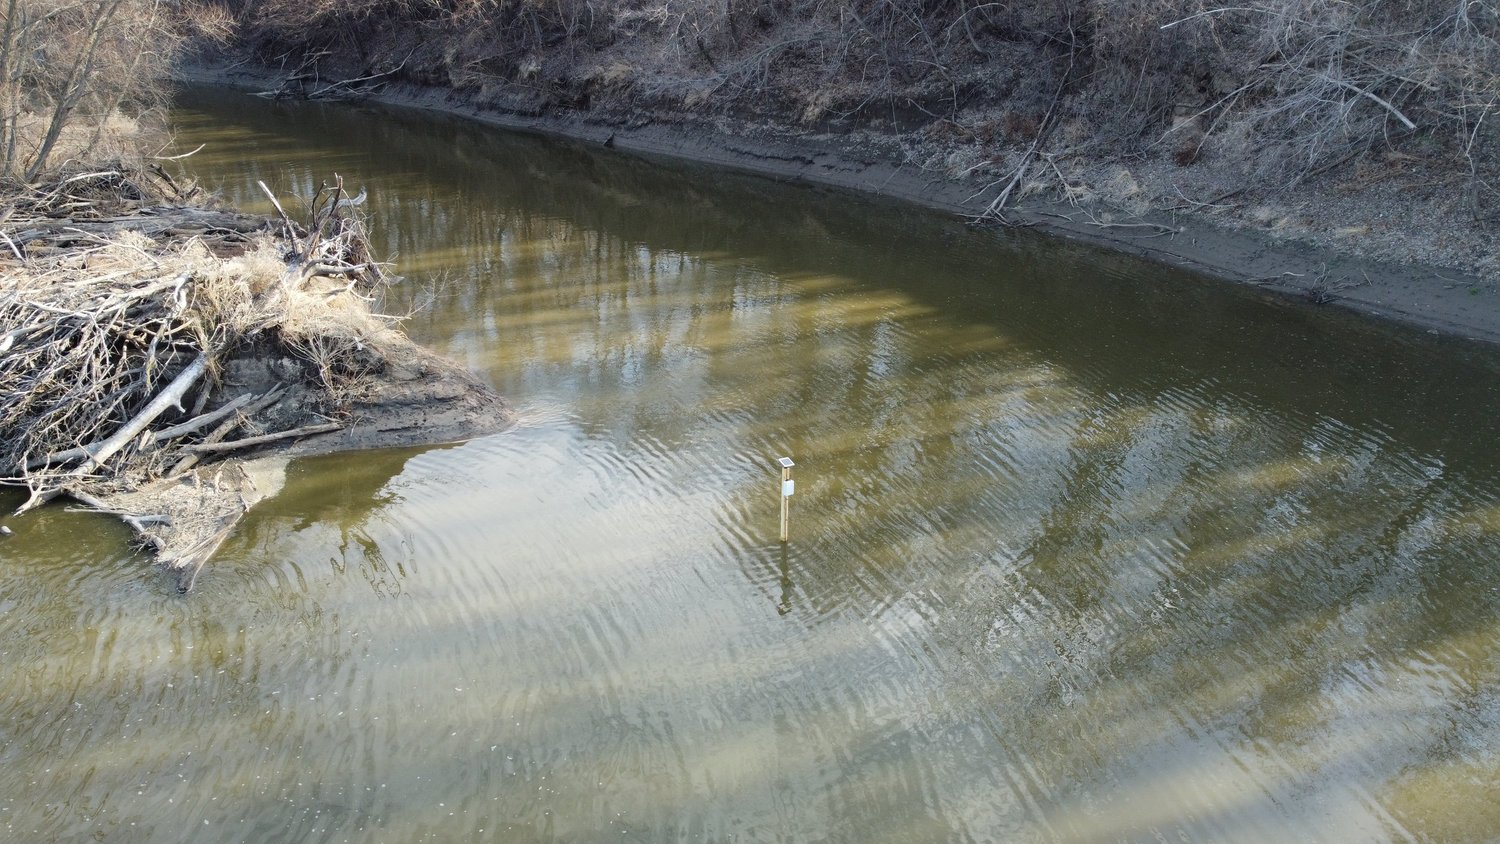
A water-monitoring prototype that I deployed on a river for roughly one to two months. It drew in water samples, measured transmitted light at different wavelengths, and compared the readings with a pure-water reference. A solar-charged battery powered the device. It stored readings locally, and I periodically visited with a handheld LoRa radio receiver to download the collected data for analysis.
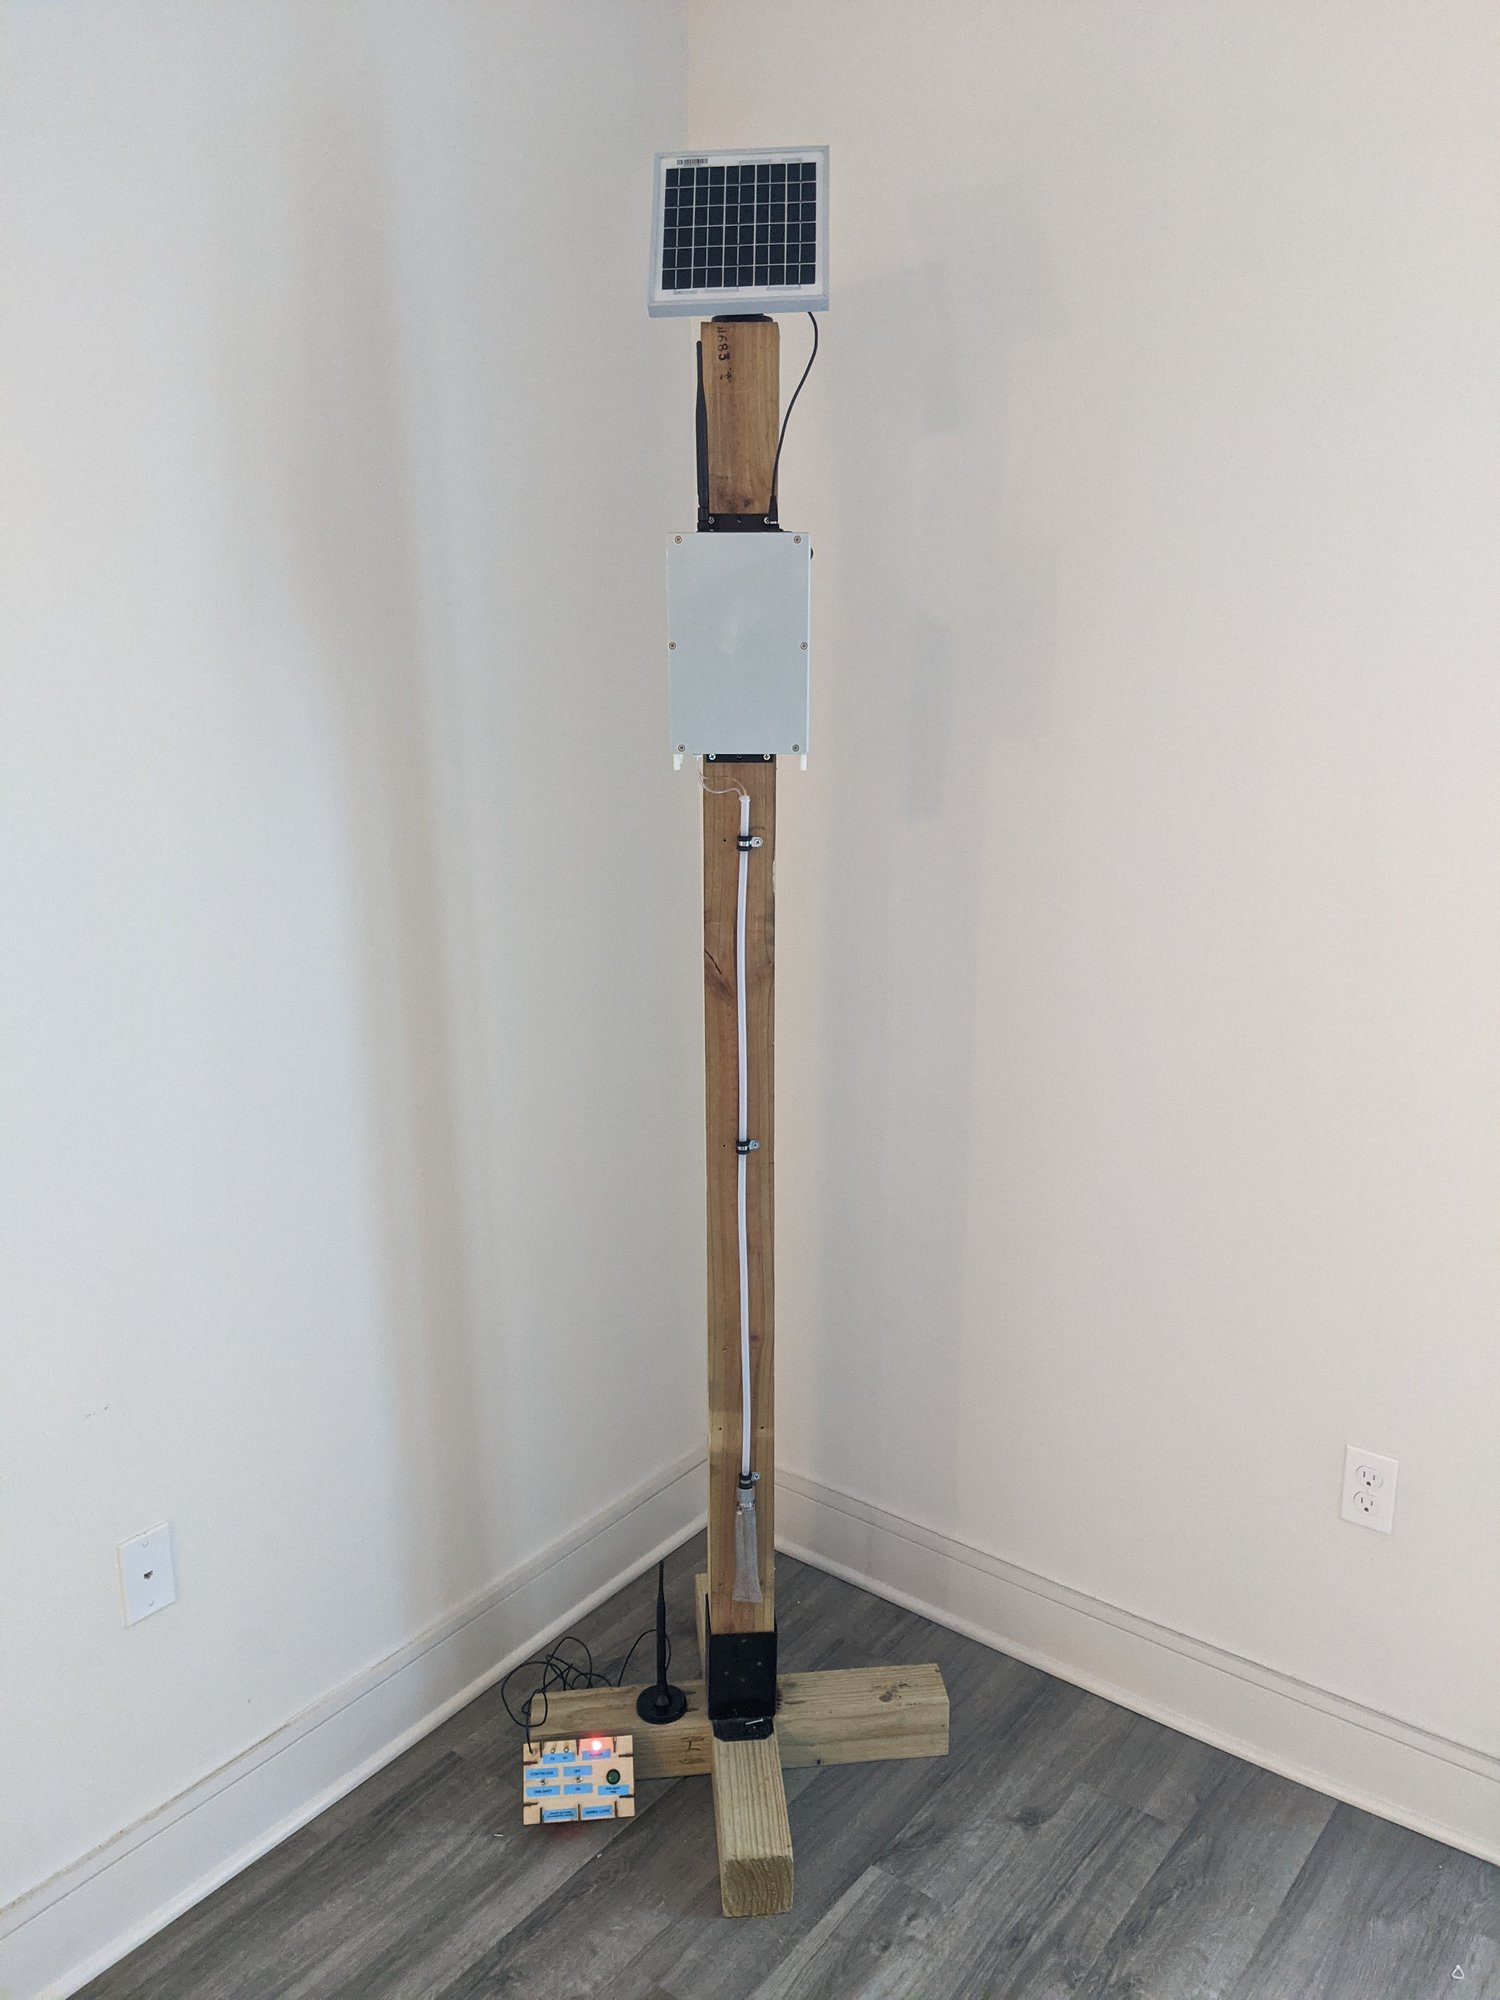
The water monitor before deployment, with its handheld receiver below. The receiver’s antenna and controls let me request the stored measurements when I came within radio range, so I could collect data without opening the monitor’s enclosure.
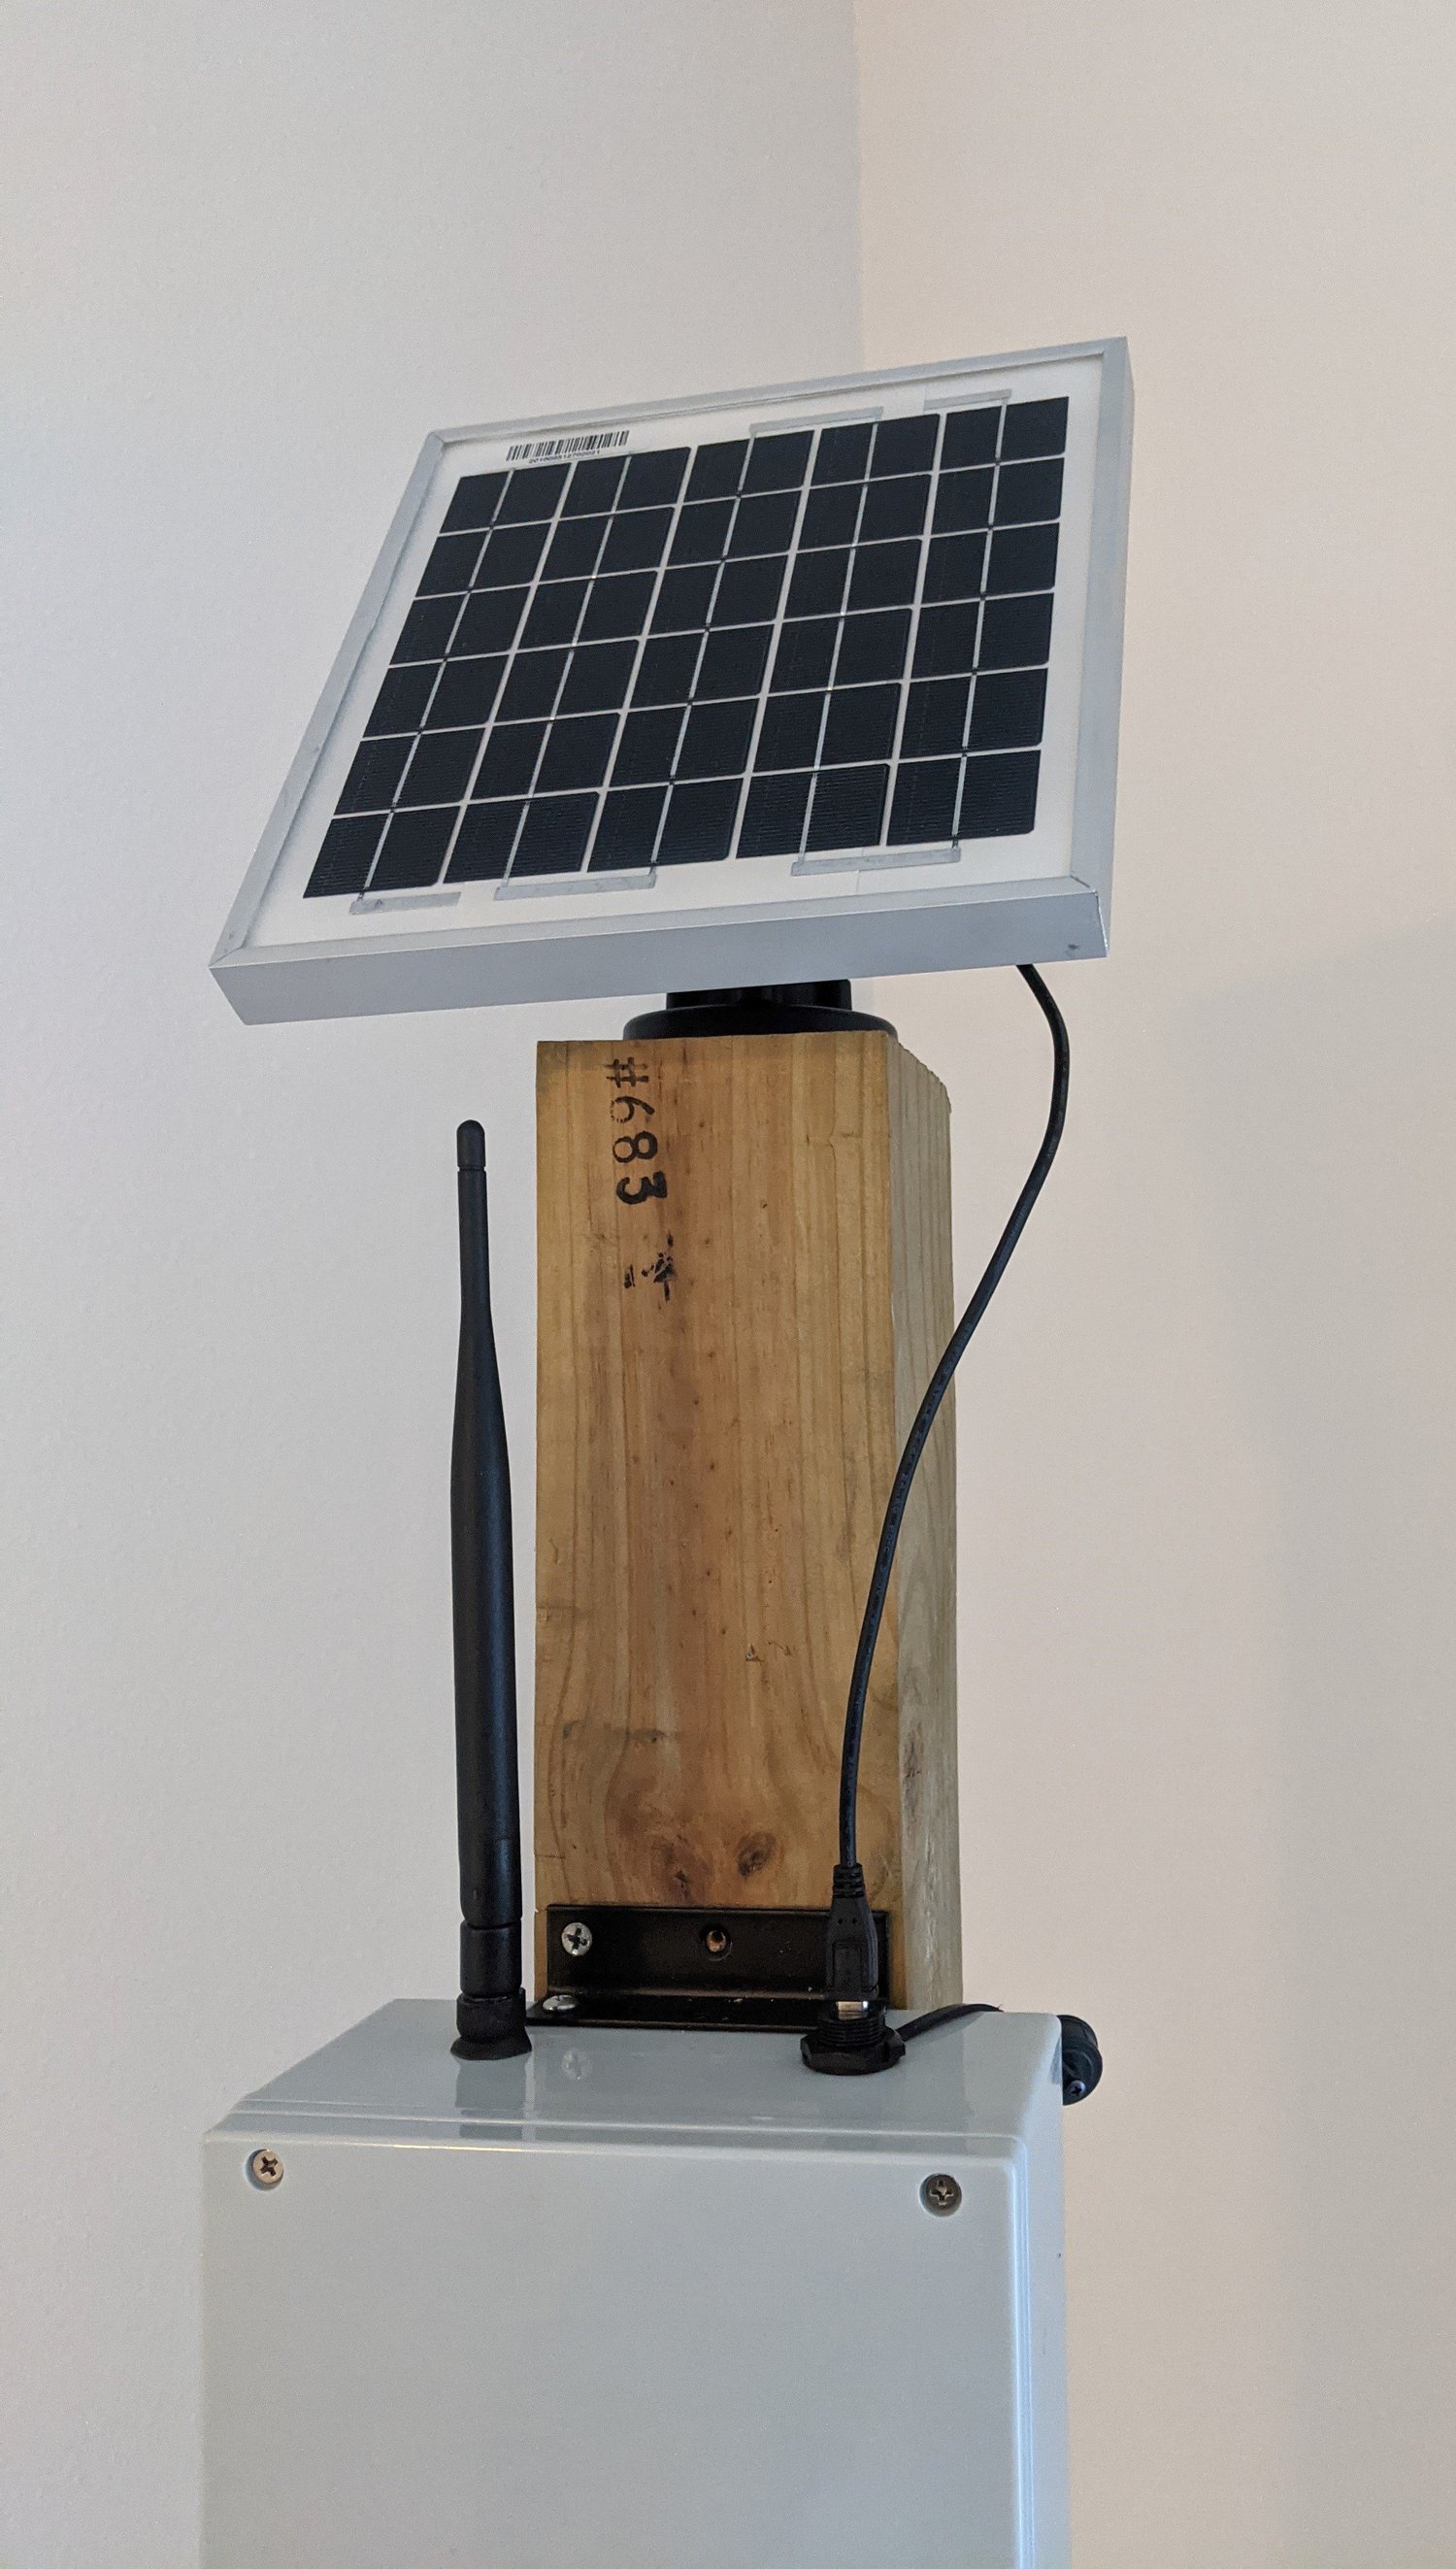
A closer view of the solar-panel arrangement. I recall this version having a larger panel than the earlier prototype, intended to improve battery charging during extended deployment.
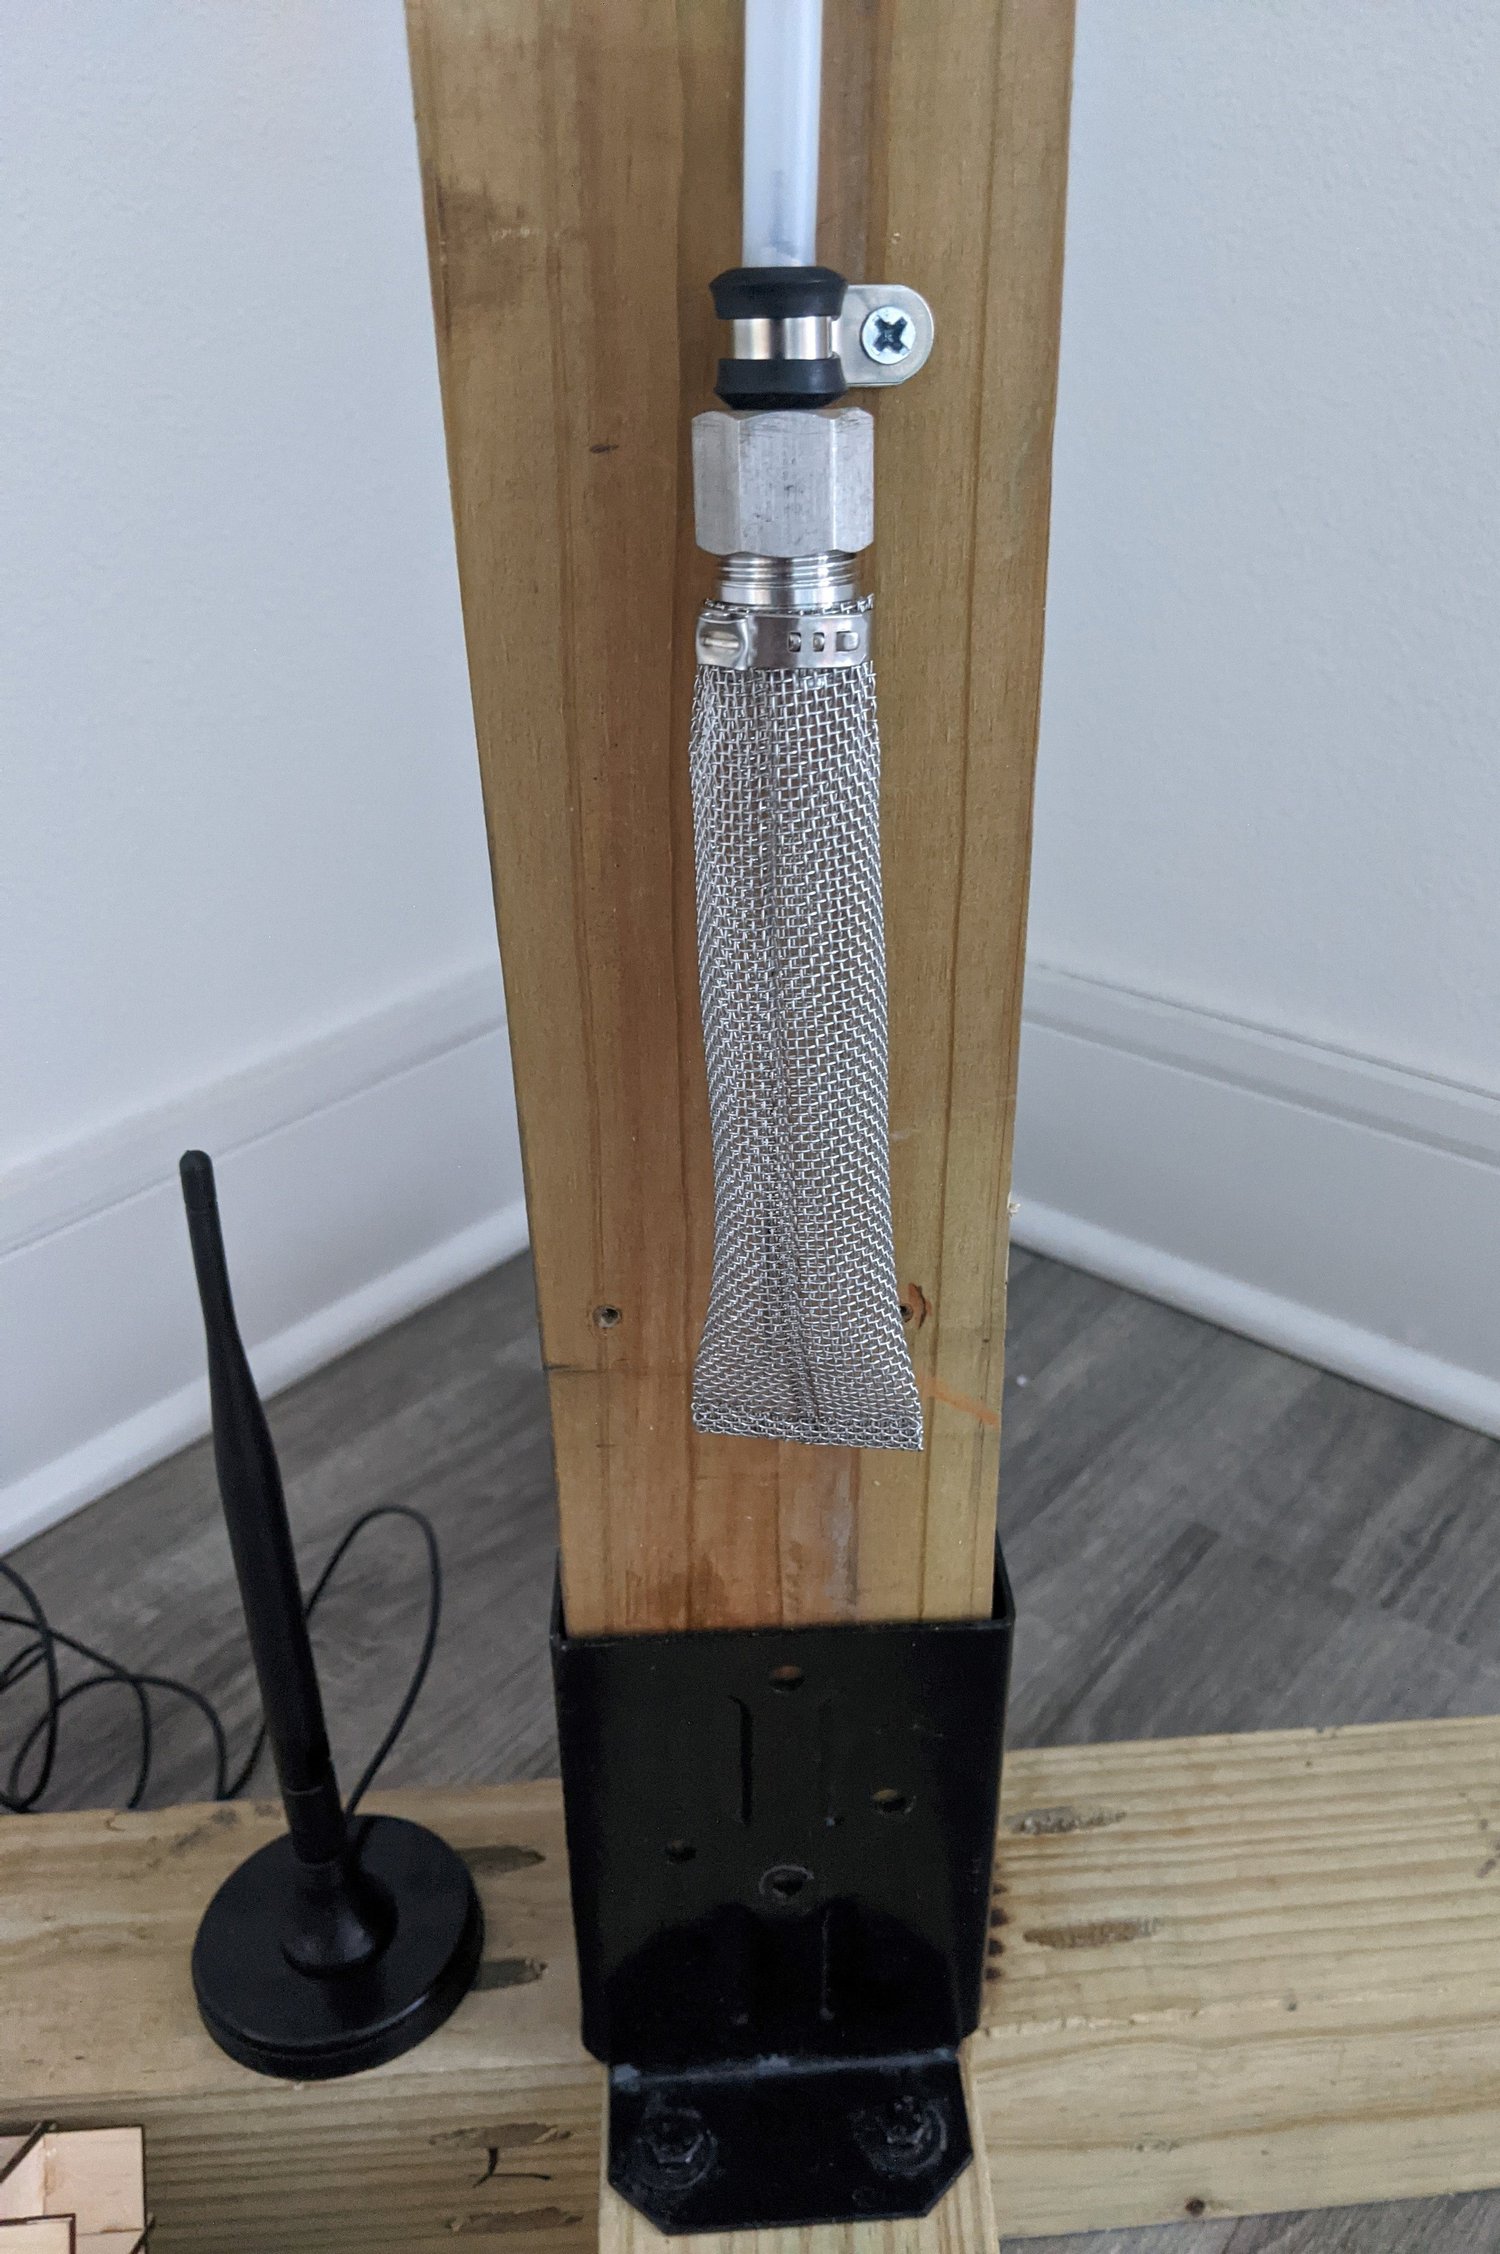
A stainless steel mesh bag protected the water intake from debris. The pumped sampling system still depended on narrow tubing that could clog. For a future version, I would investigate placing the optical sensor head directly in the water and using a simple wiper to keep its window clean, removing the intake pump and tubing.
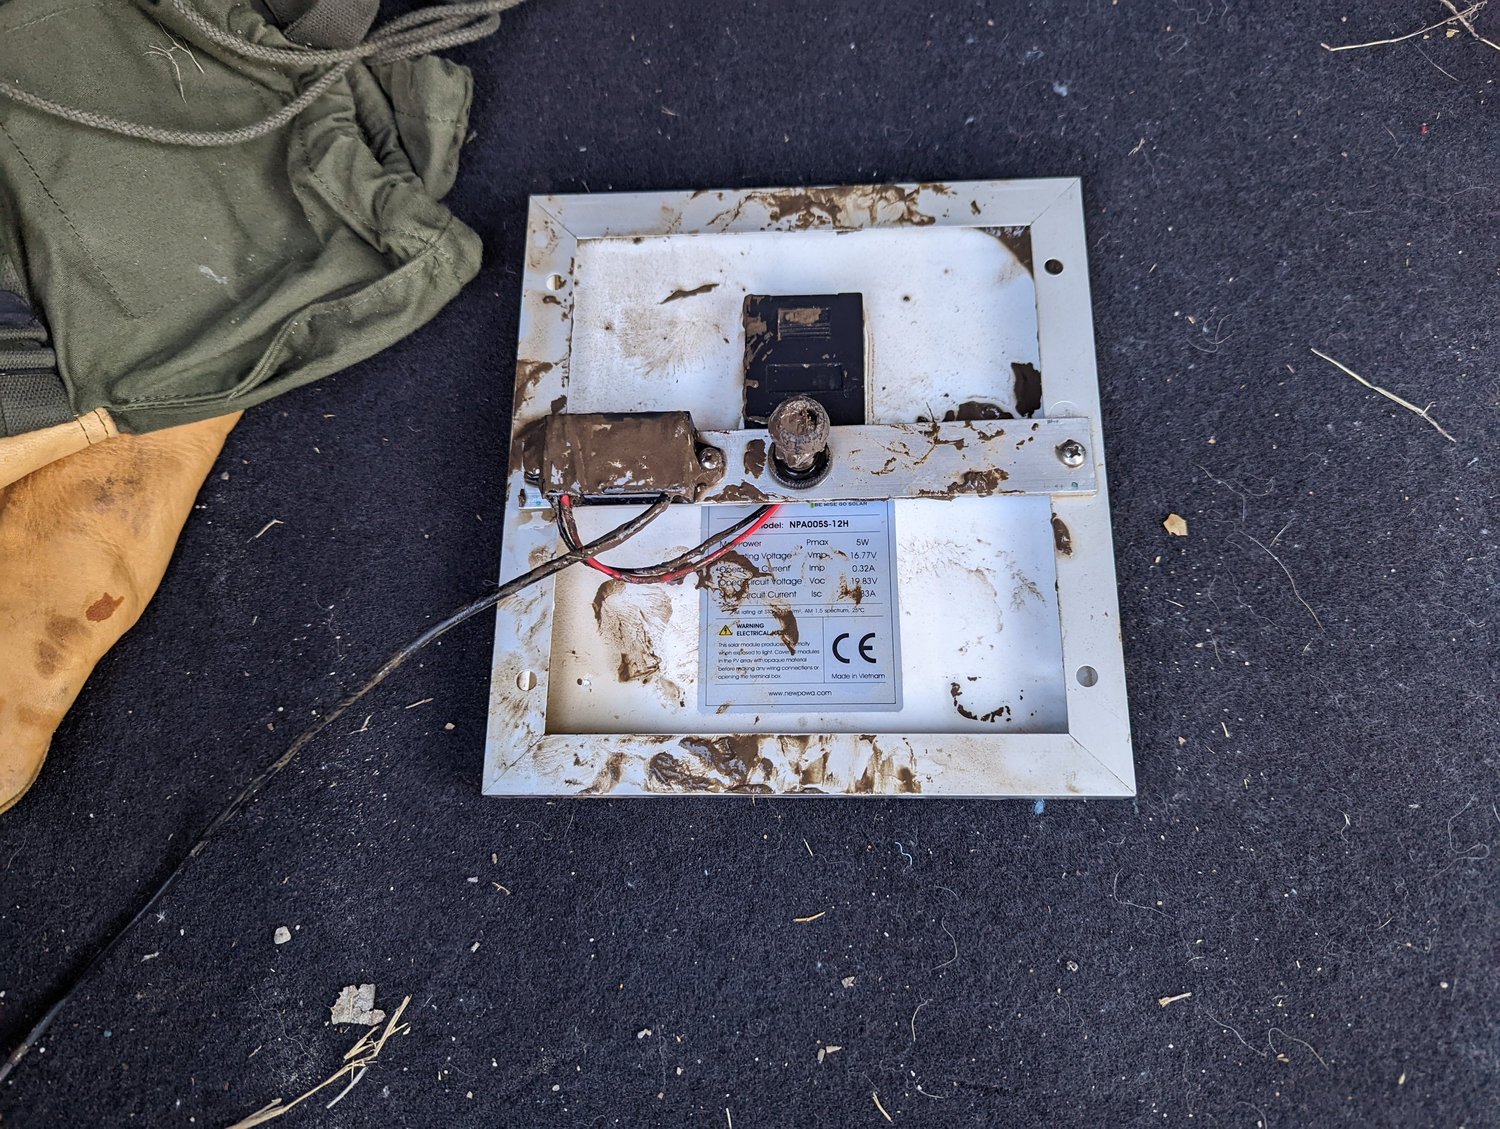
The monitor after rising water had submerged the whole assembly for about a day or two. When the river receded, I was pleased to find it still attached; I had worried it might have been carried downstream.
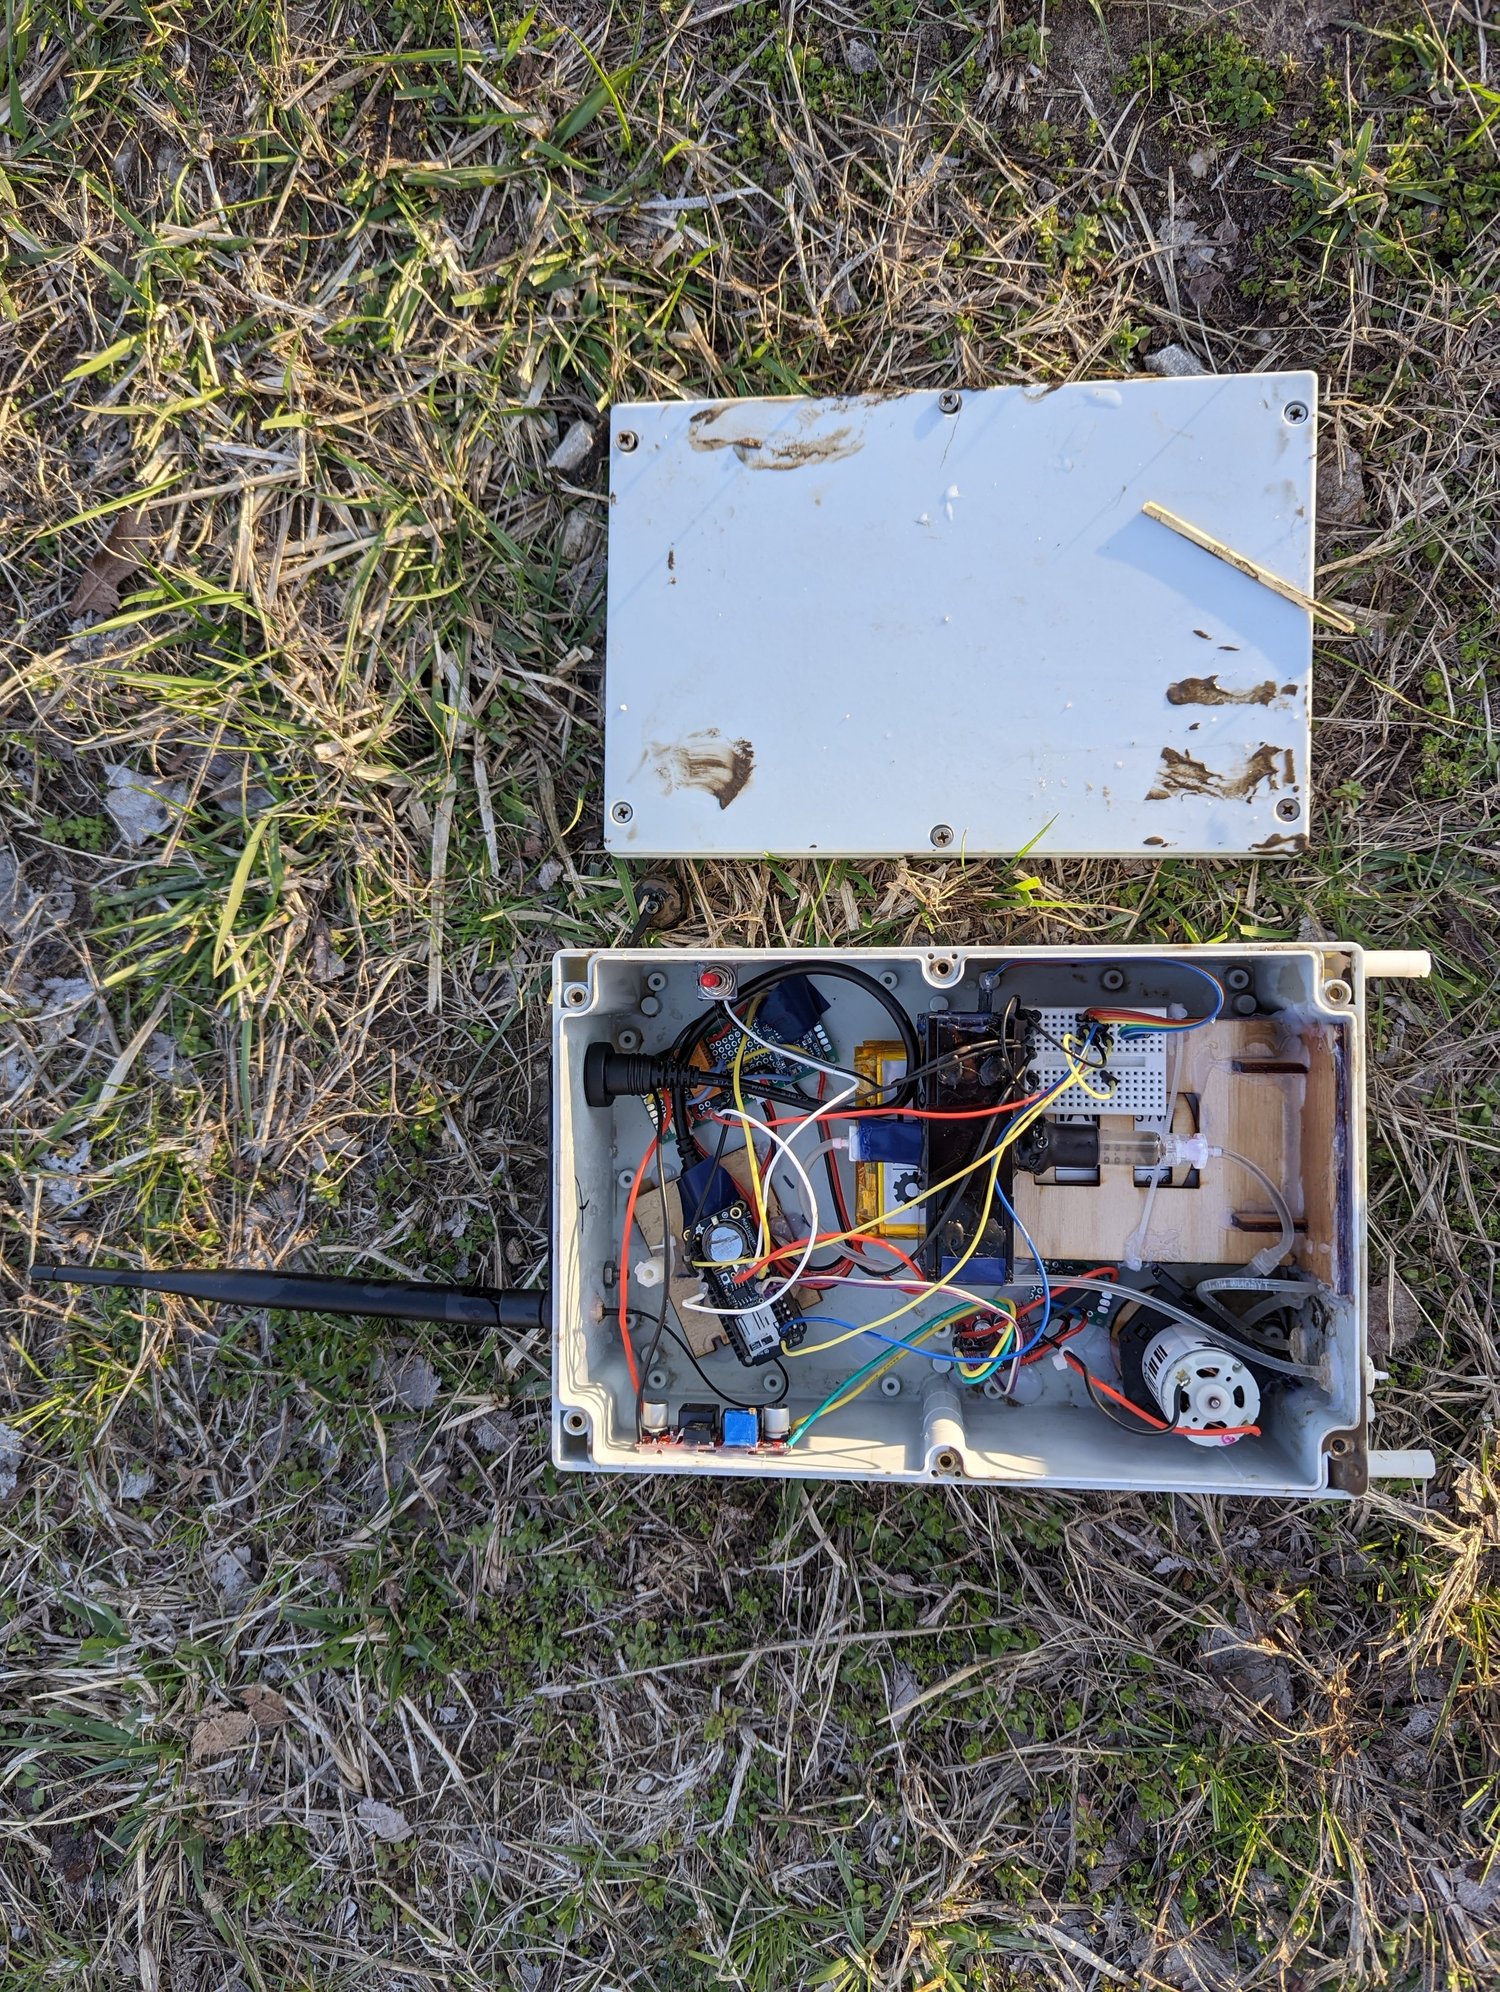
Another view after the submersion. The monitor appeared to have stopped because its battery ran down while the submerged solar panel could not recharge it. Once the battery was recharged, the device worked again.
Earlier radio-connected monitor
Photos 106–112
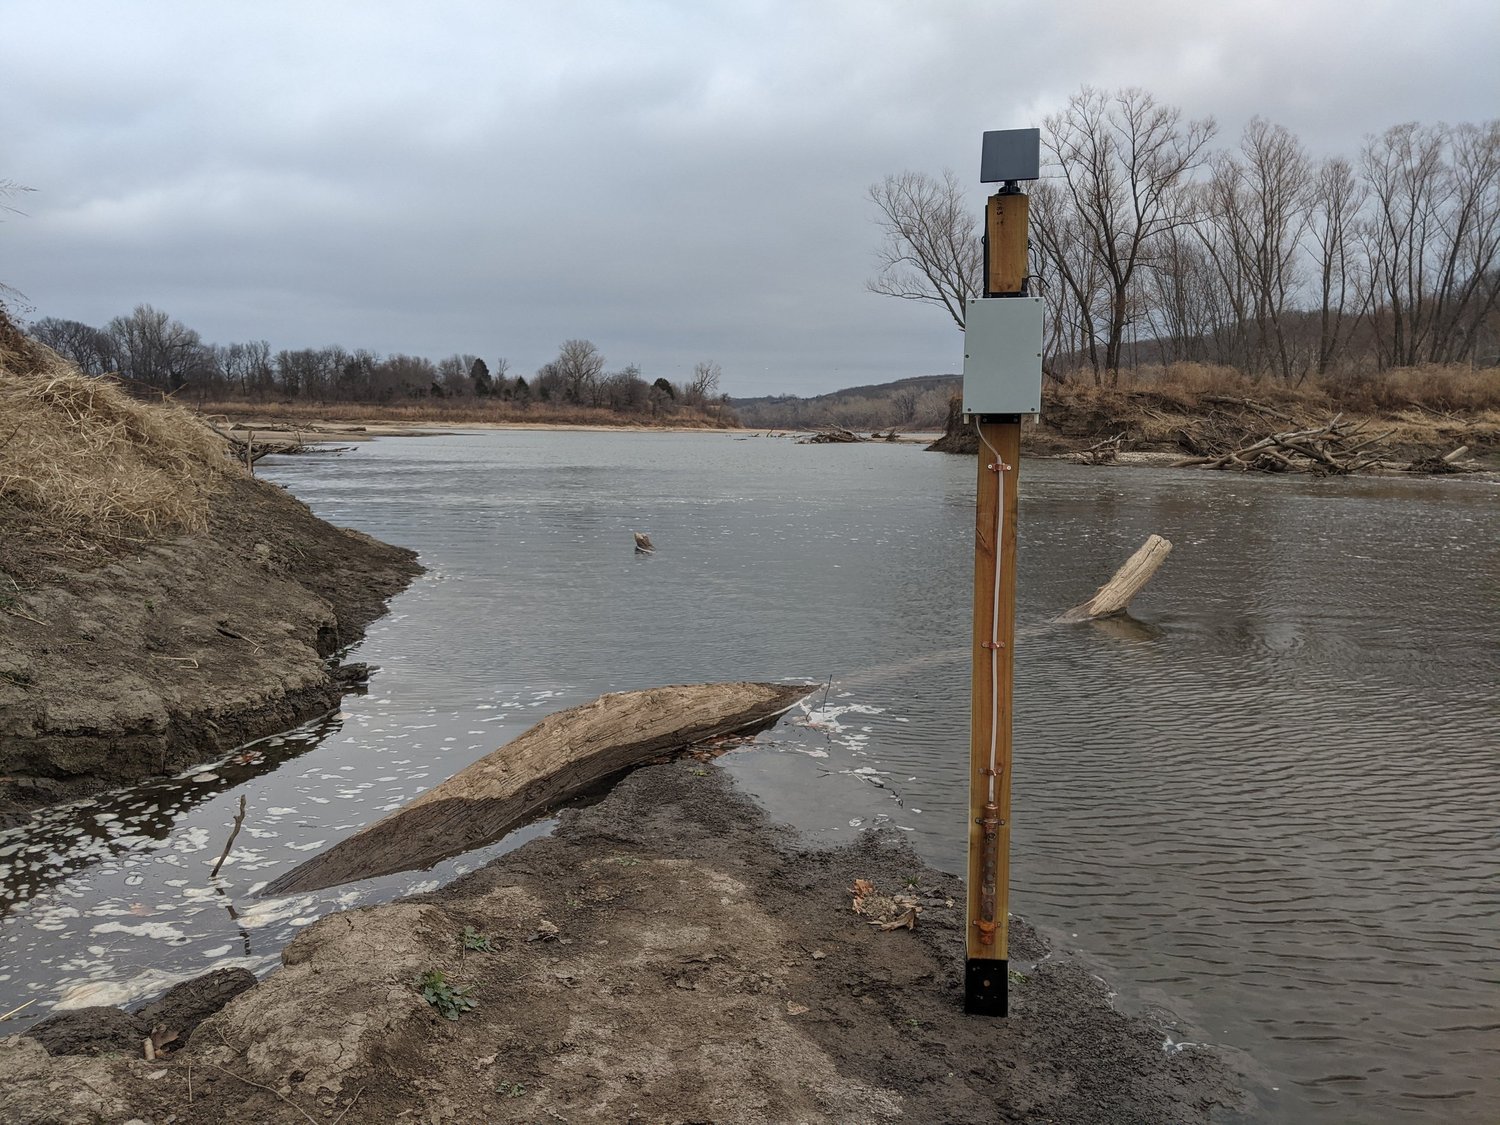
An earlier water-monitor prototype with a smaller solar panel and a copper-pipe guard around the intake. The guard helped keep larger debris away, but the narrow sampling tube remained a potential clogging point. This was one reason I later considered eliminating the pump and measuring directly in the water.
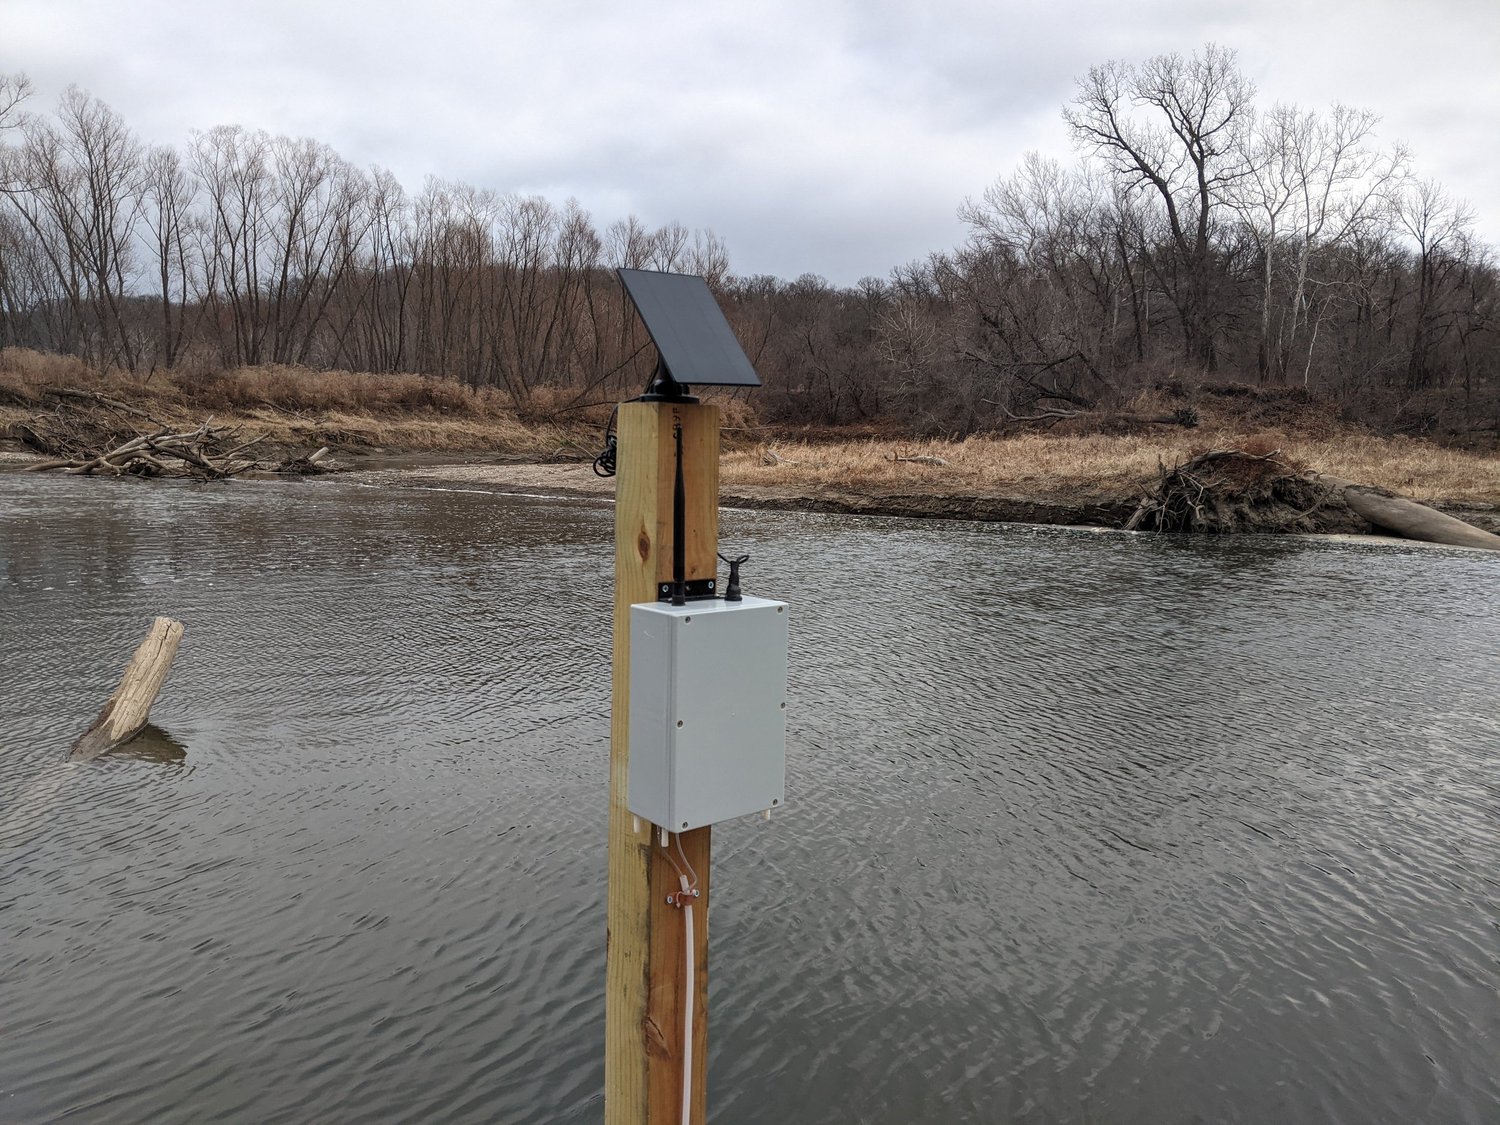
A different angle on the earlier deployed monitor. This version combined solar power, radio data retrieval, and a pumped water-sampling arrangement in a compact assembly.
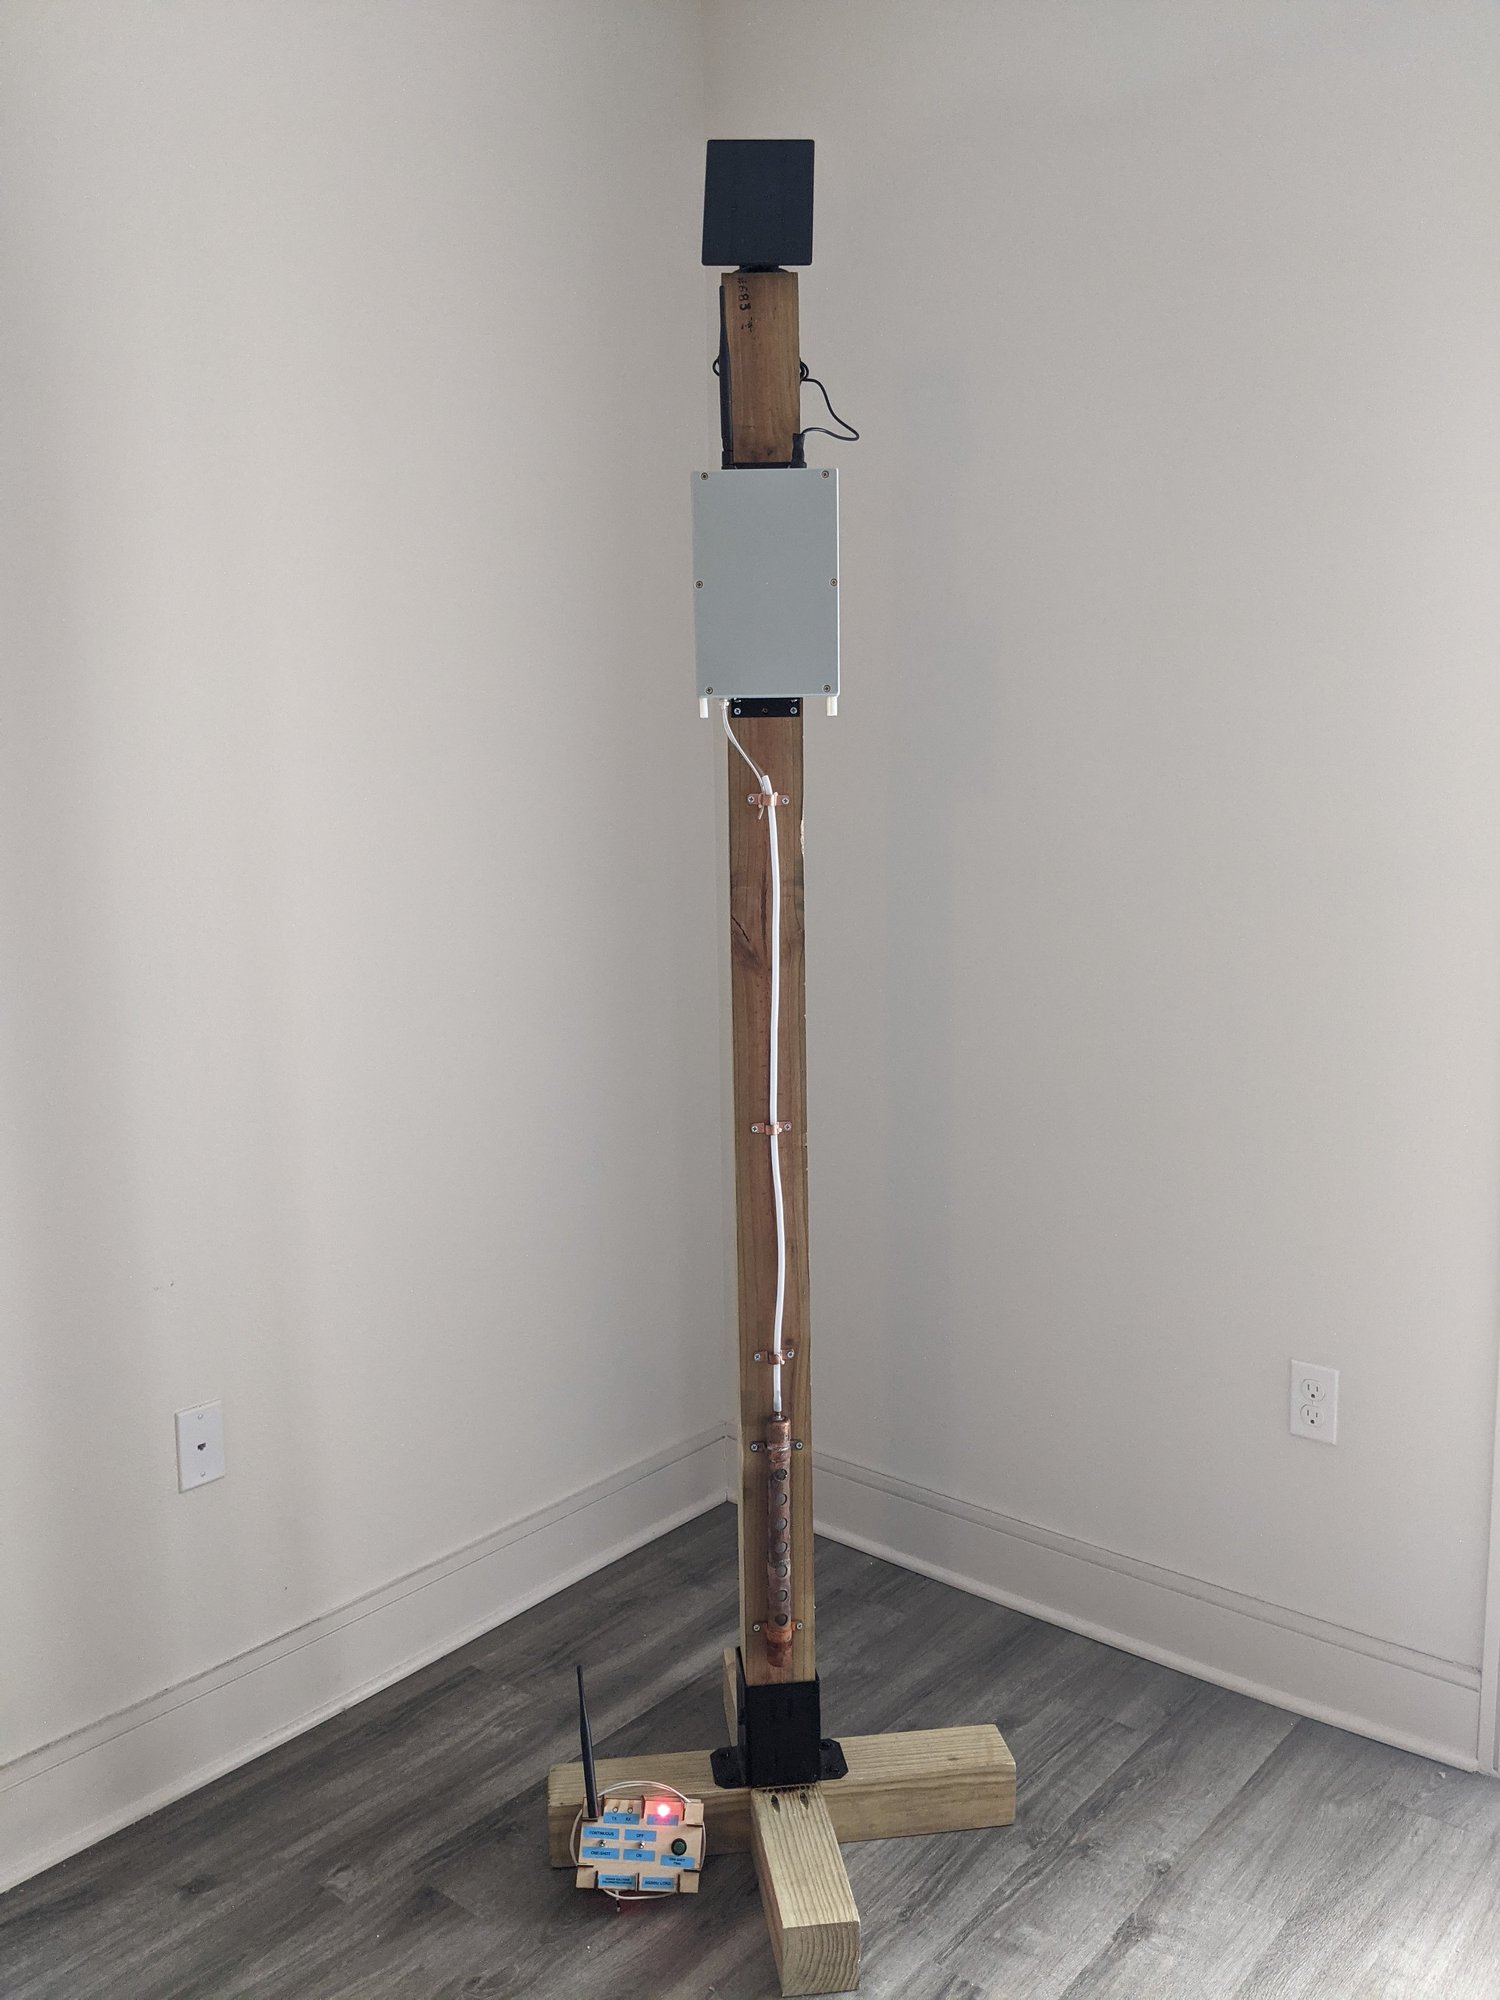
The earlier water-monitor assembly before installation. This view records the prototype as it was prepared for testing beside the river.
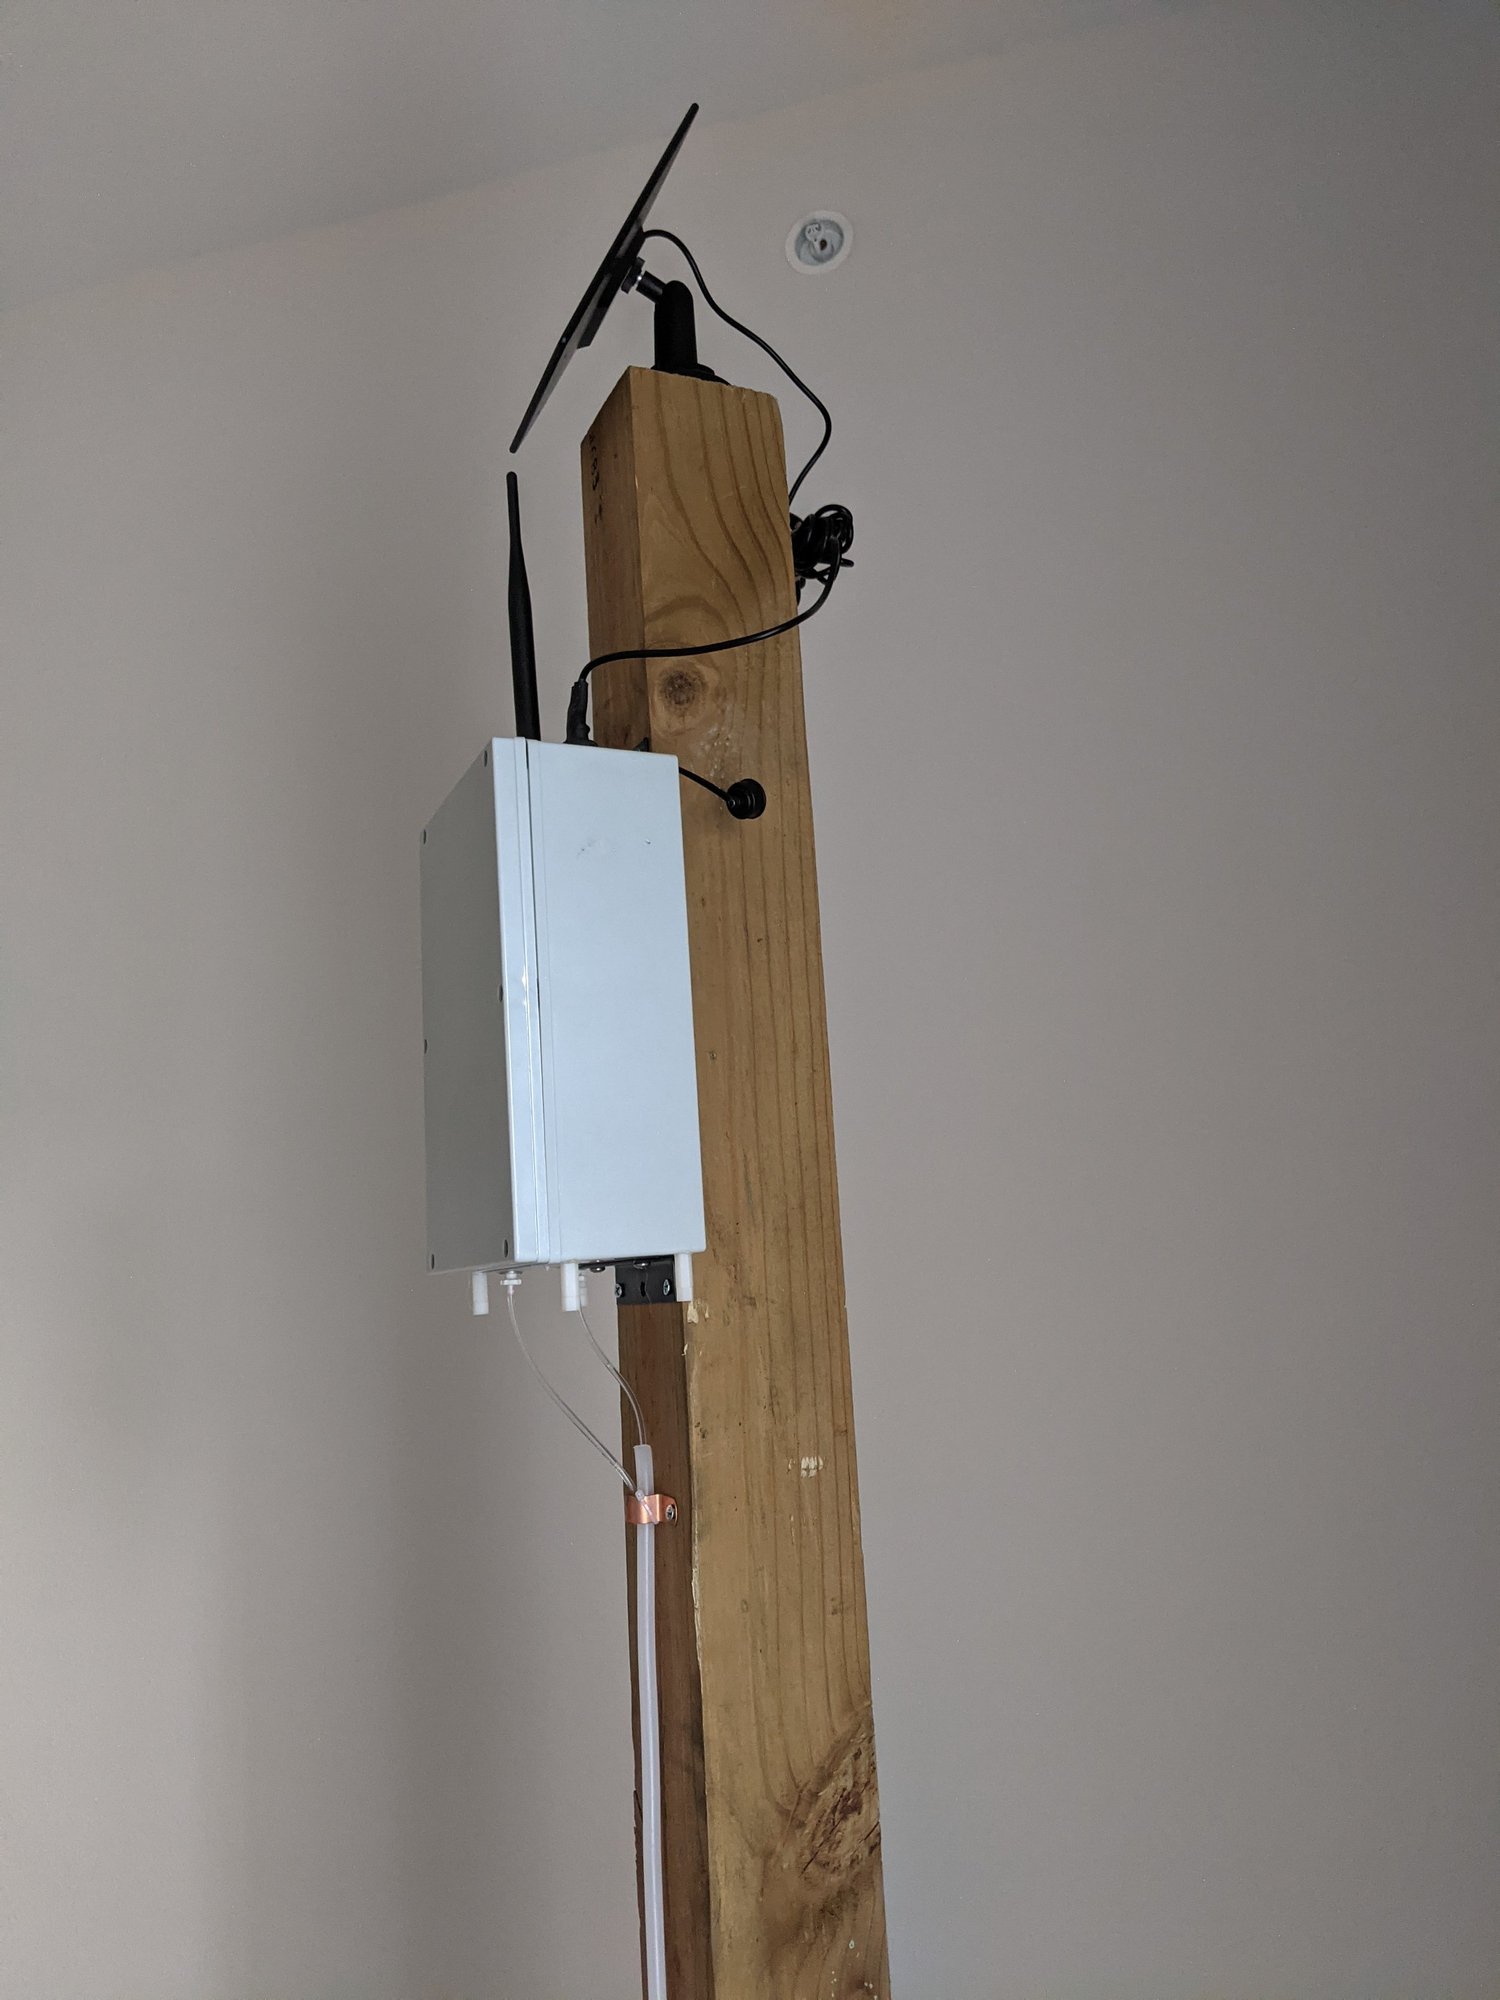
Another view of the same monitor before deployment. These photographs document the assembly and its external components before the field test.
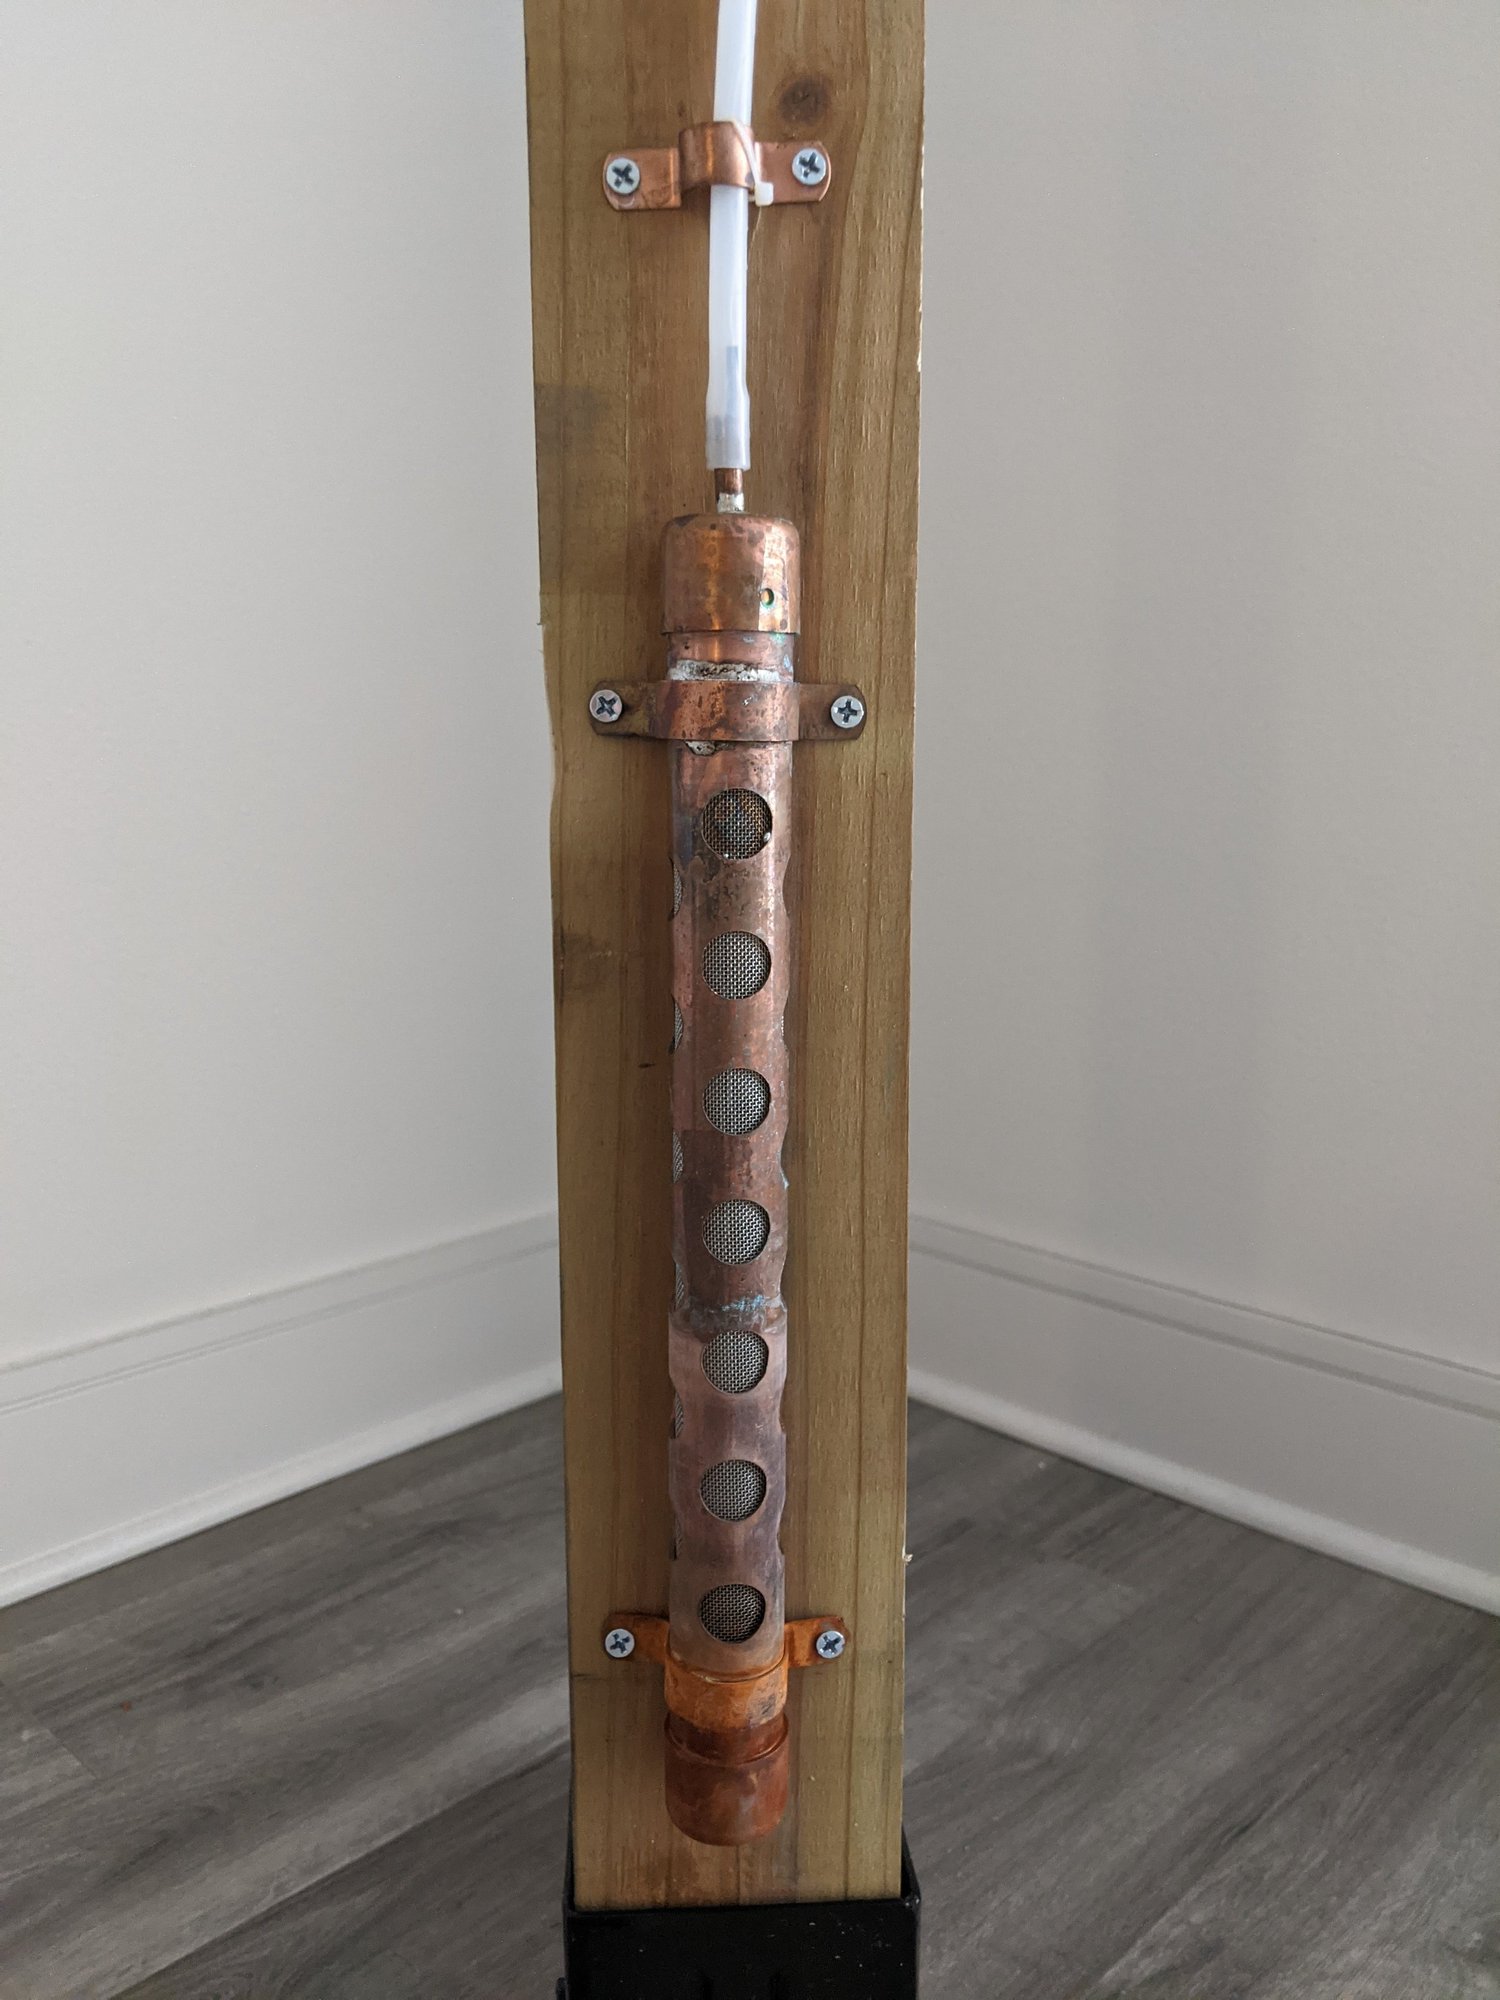
A closer view of the copper component used to guard the sampling intake. I was trying to reduce debris entering the device and also considered whether copper might help limit biological growth. The narrow tube behind the guard remained the more important reliability concern.
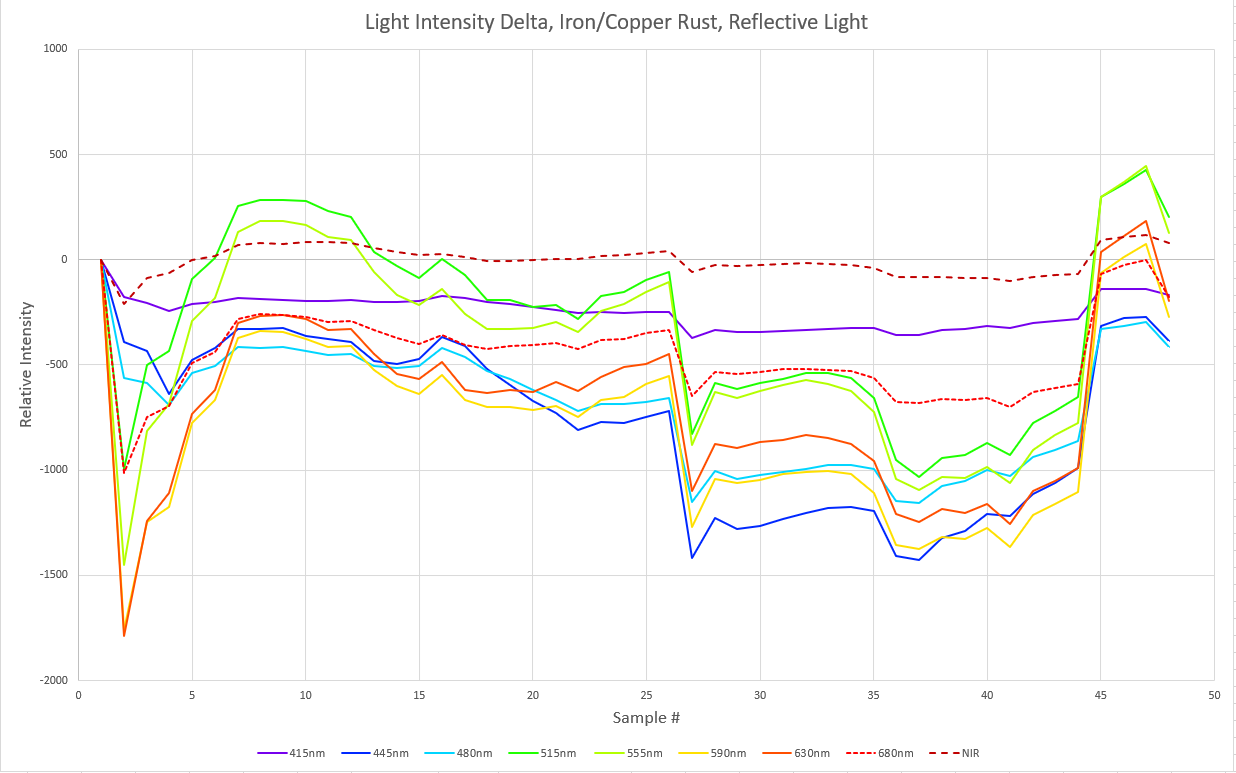
An example of multichannel optical data: each colored trace represents a different wavelength band, and the horizontal axis follows successive samples. Plots like this let me compare how the measured light intensity changed across channels. This particular chart is labeled as a reflected-light test.
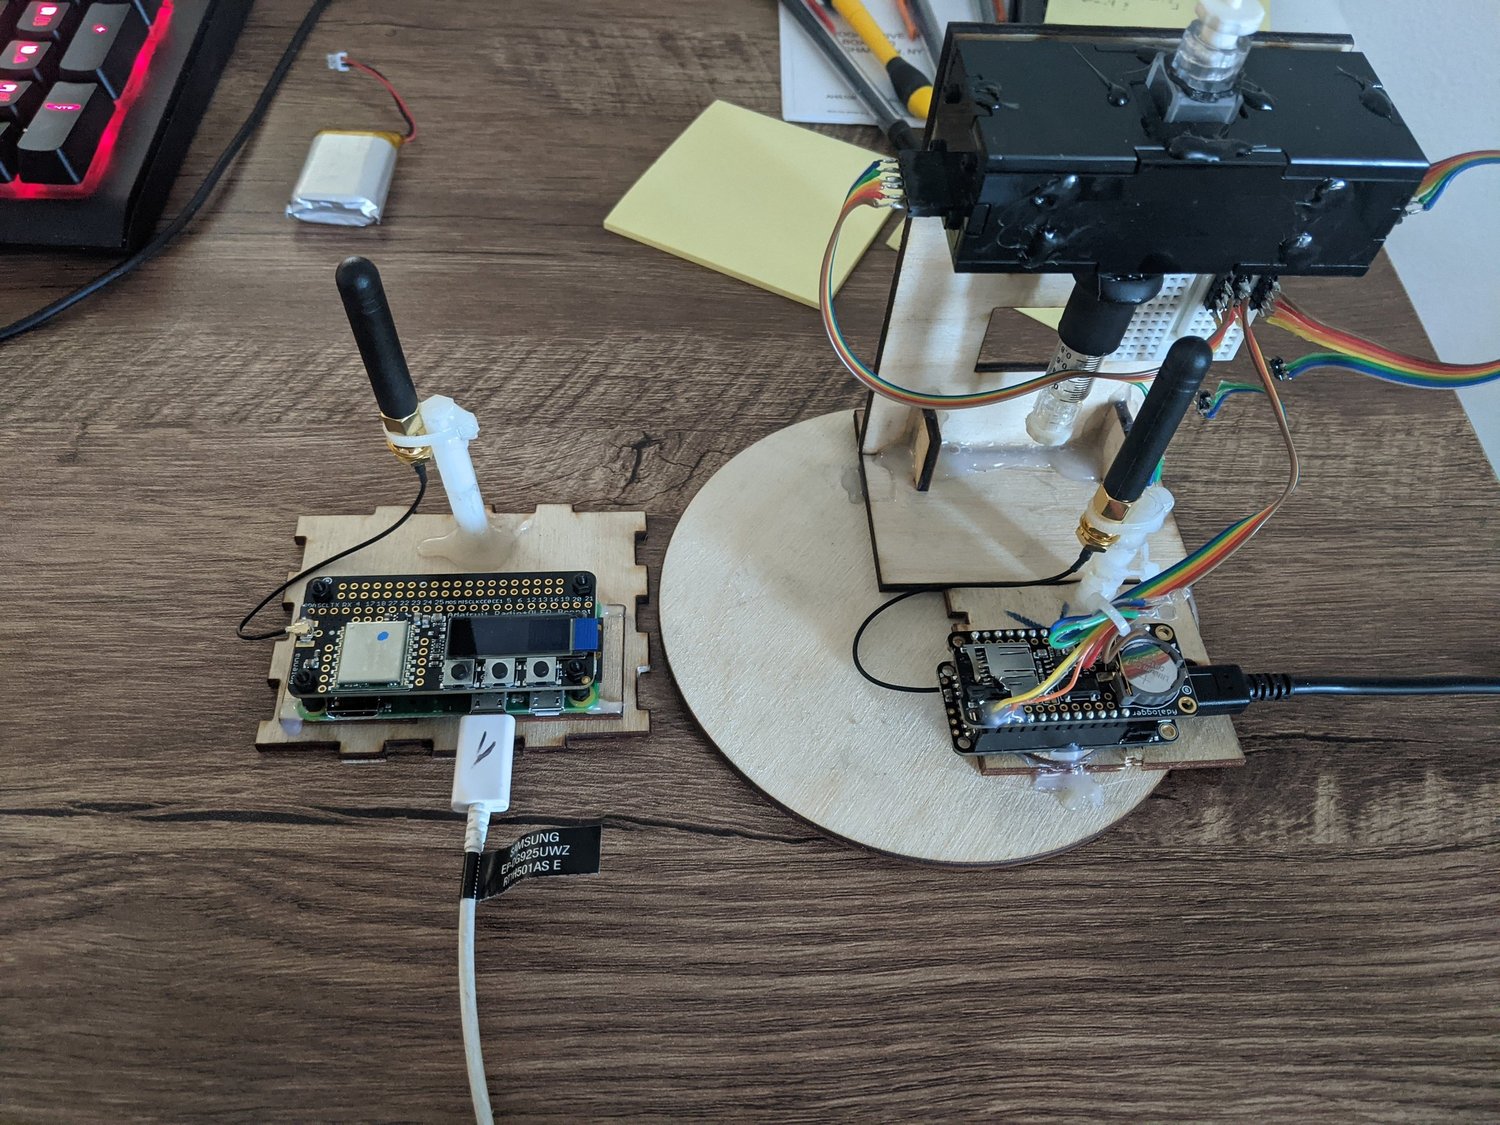
An early iteration of the optical water monitor and its radio receiver. I later changed the receiver and used larger antennas on both ends of the LoRa link while developing the field-deployment version.
Bench spectrometer and collected samples
Photos 113–123
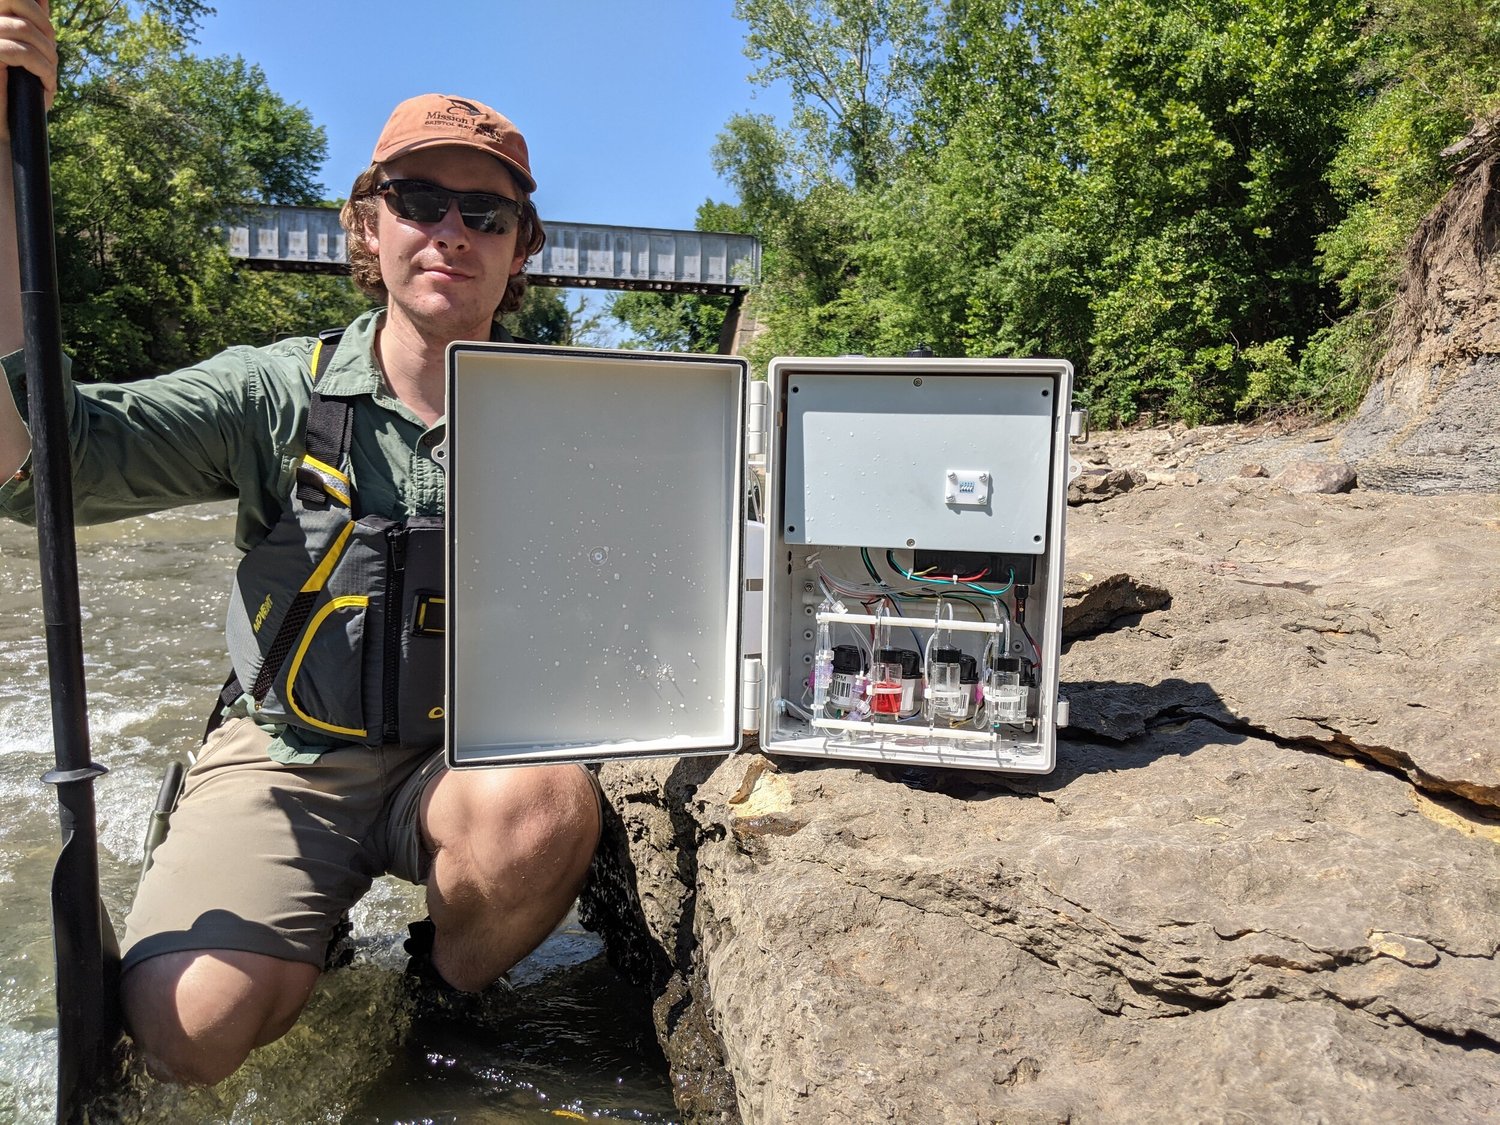
An earlier, larger monitor controlled by a Raspberry Pi. A tungsten lamp shone through the water sample; a lens and diffraction grating then spread the transmitted light across a linear photodiode array—a row of light detectors. I experimentally mapped detector positions to wavelengths and used their readings to compare the light transmitted by different samples.
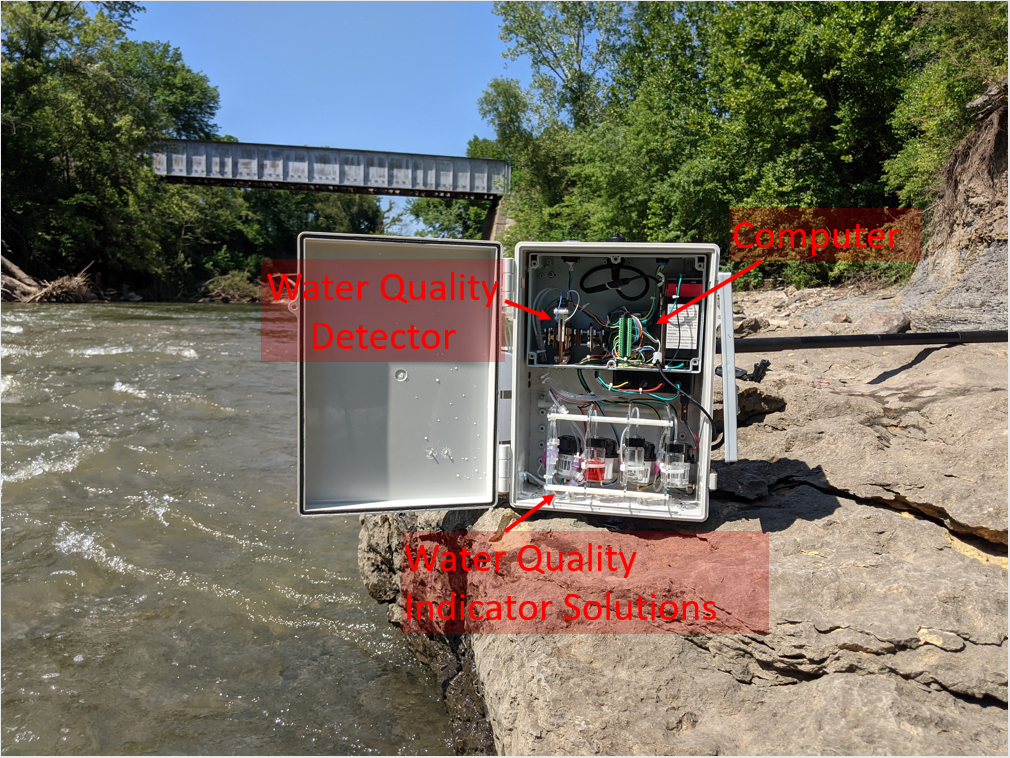
An annotated view of the larger monitor’s optical sensor, computer, and indicator-solution containers. I explored adding wet-chemistry tests, but could not dose the reagents consistently enough, so I used the optical transmission measurements. For a future dosing system, I would investigate smaller peristaltic pumps, which move fluid by squeezing flexible tubing.
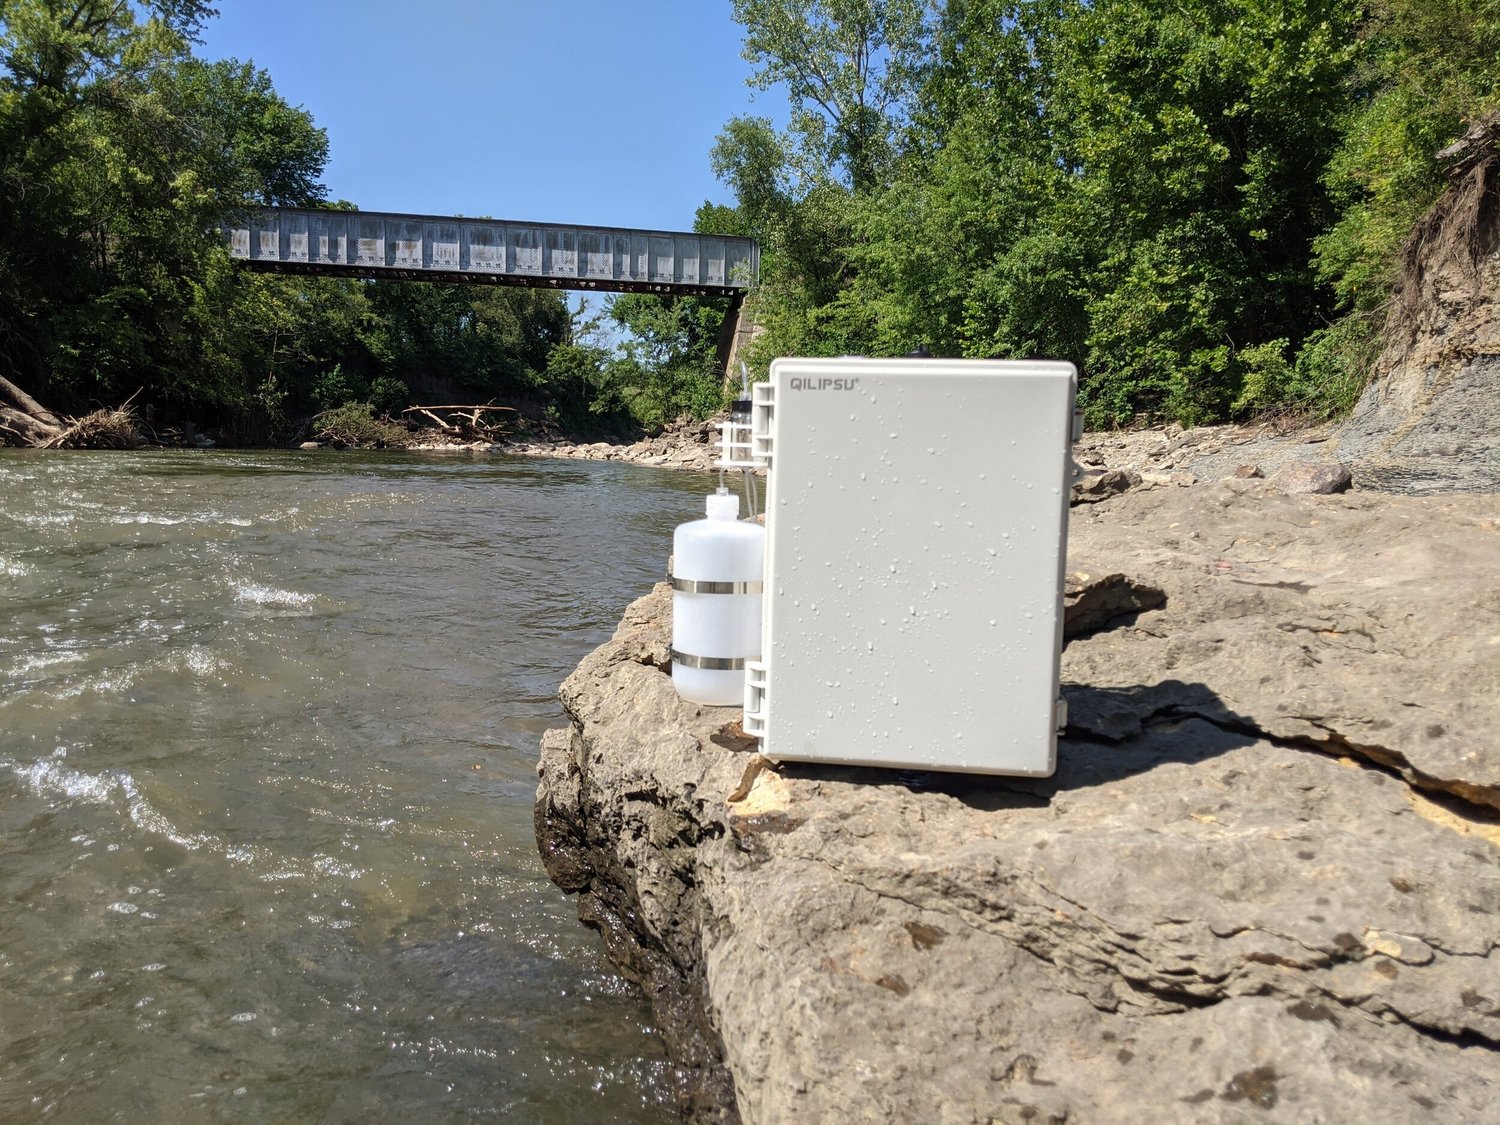
The larger water-monitor assembly with its enclosure closed, photographed at the river. Later iterations enclosed the sample’s fluid path more fully to reduce the risk of overflow if a pump failed to stop.
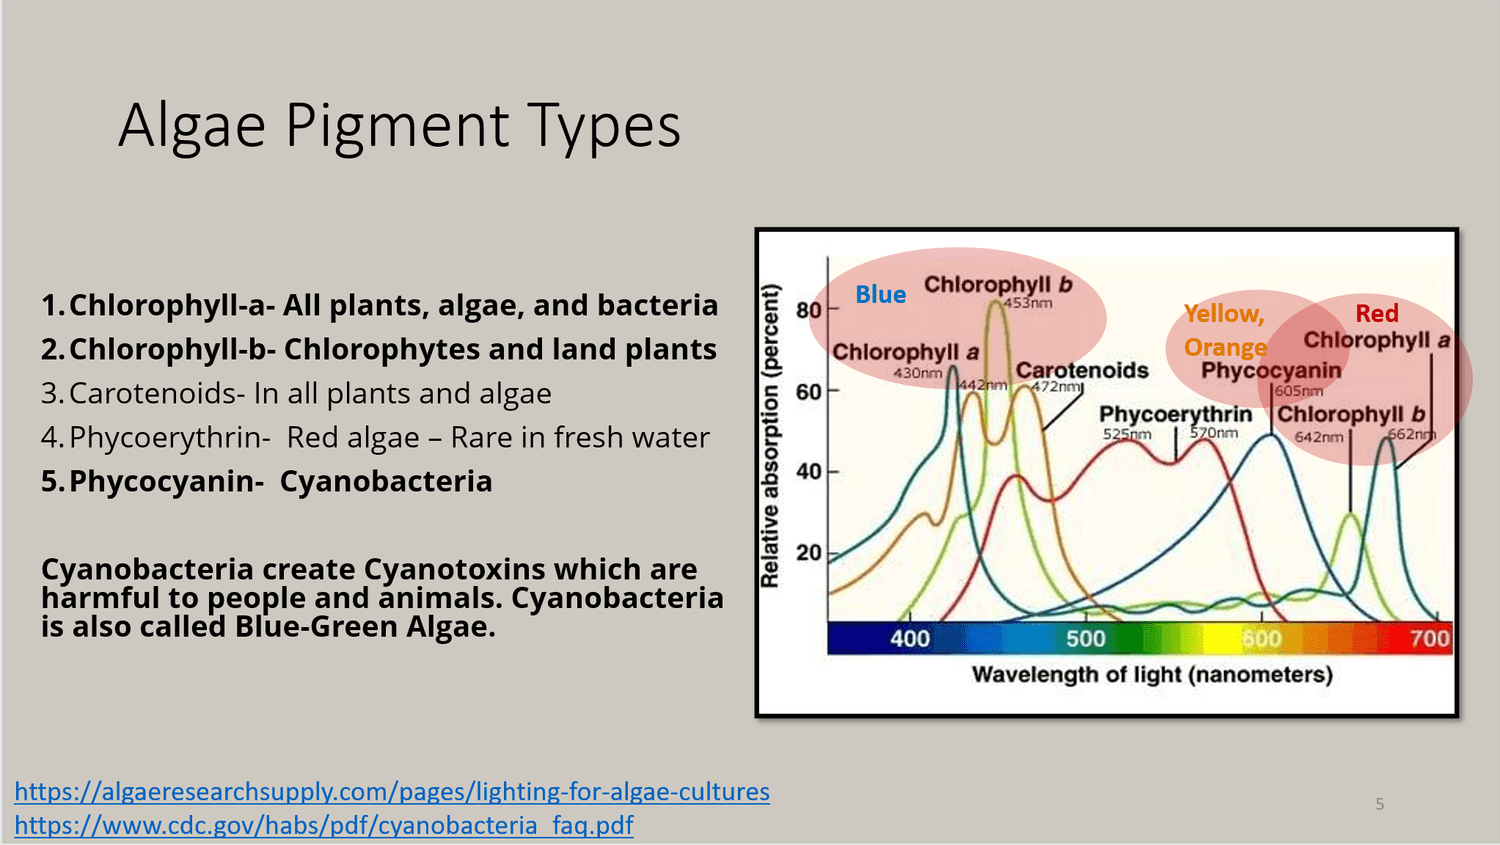
I was investigating whether reduced light transmission at particular wavelengths could suggest the presence of different algae pigments. The next step was to grow known algae cultures and compare their measurements, but a move interrupted the project before I did that work. I still have the device; calibration and controlled validation remain necessary to turn the idea into a reliable monitoring product.
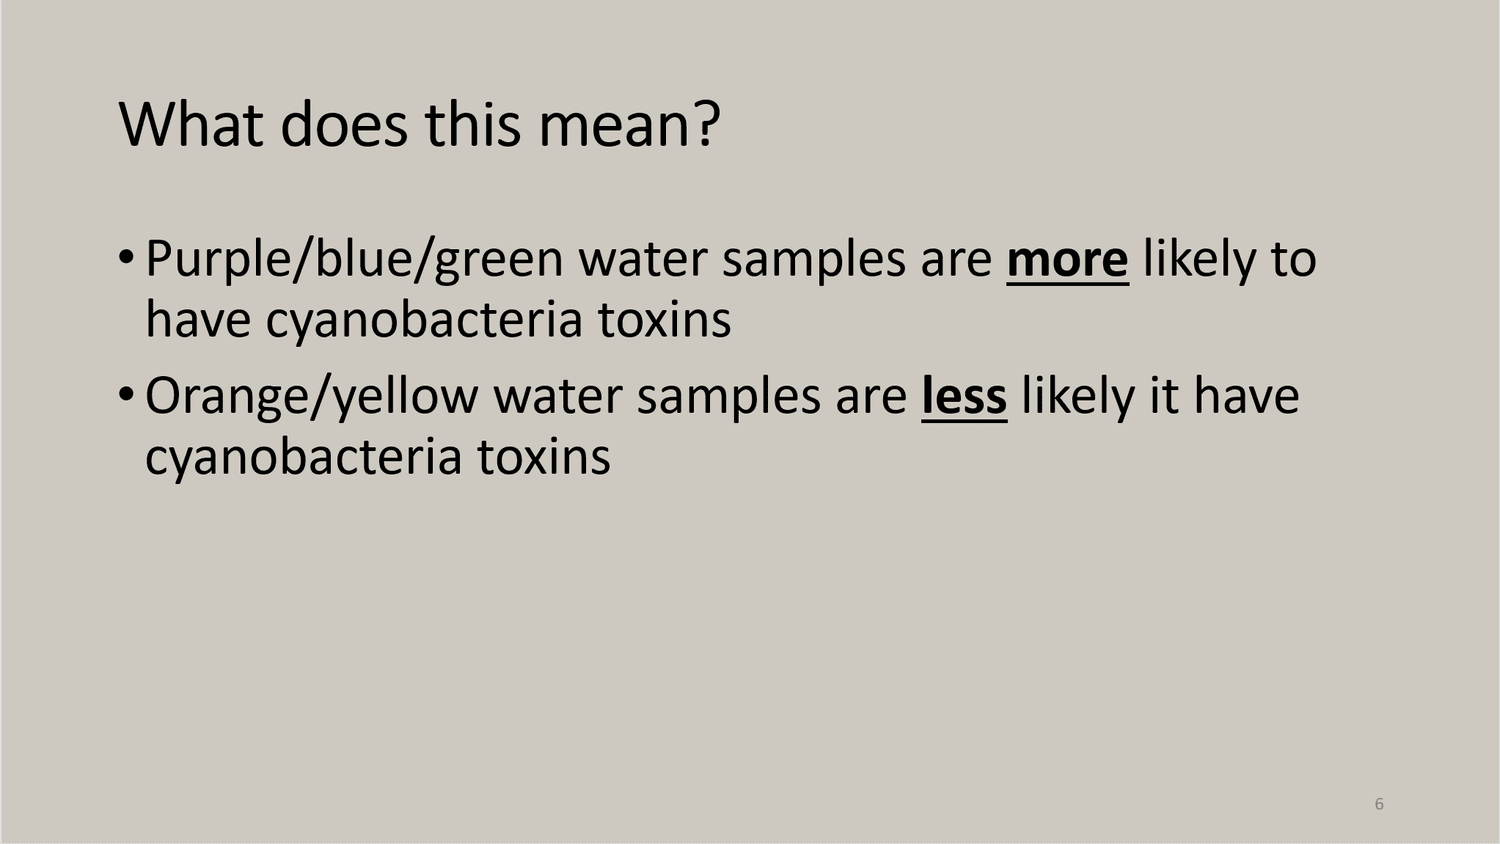
One of the slides I shared with my local water authority and water-quality scientists. I wanted to explain the optical approach, why differences between algae pigments interested me, and what I hoped further experiments could establish.
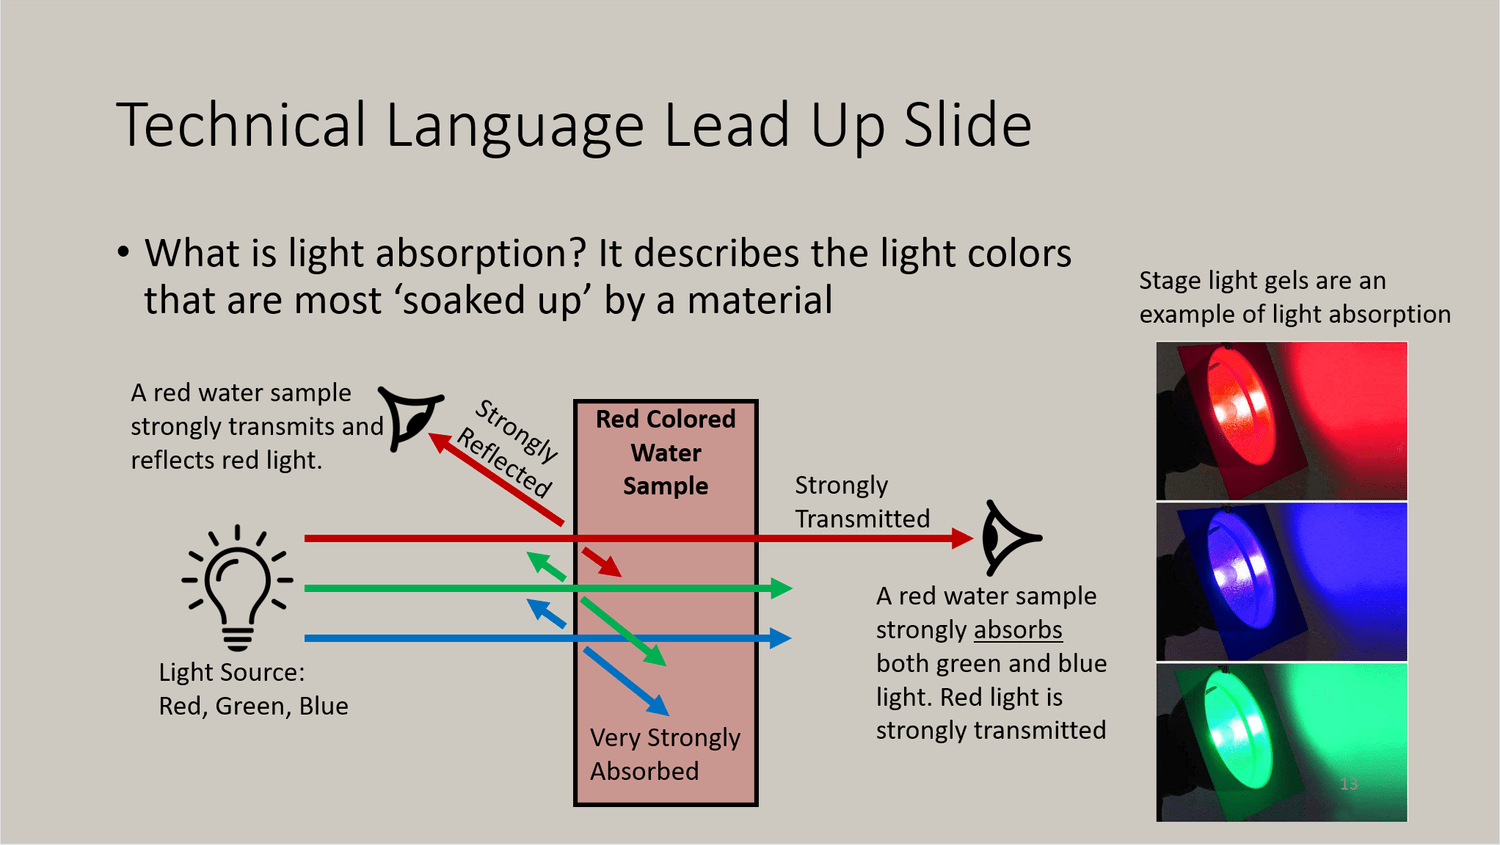
A slide for a less technical audience, introducing light transmission, absorption, and reflection. It helped explain the measurement idea: shine light through a water sample and compare the light that emerges with a reference measurement.
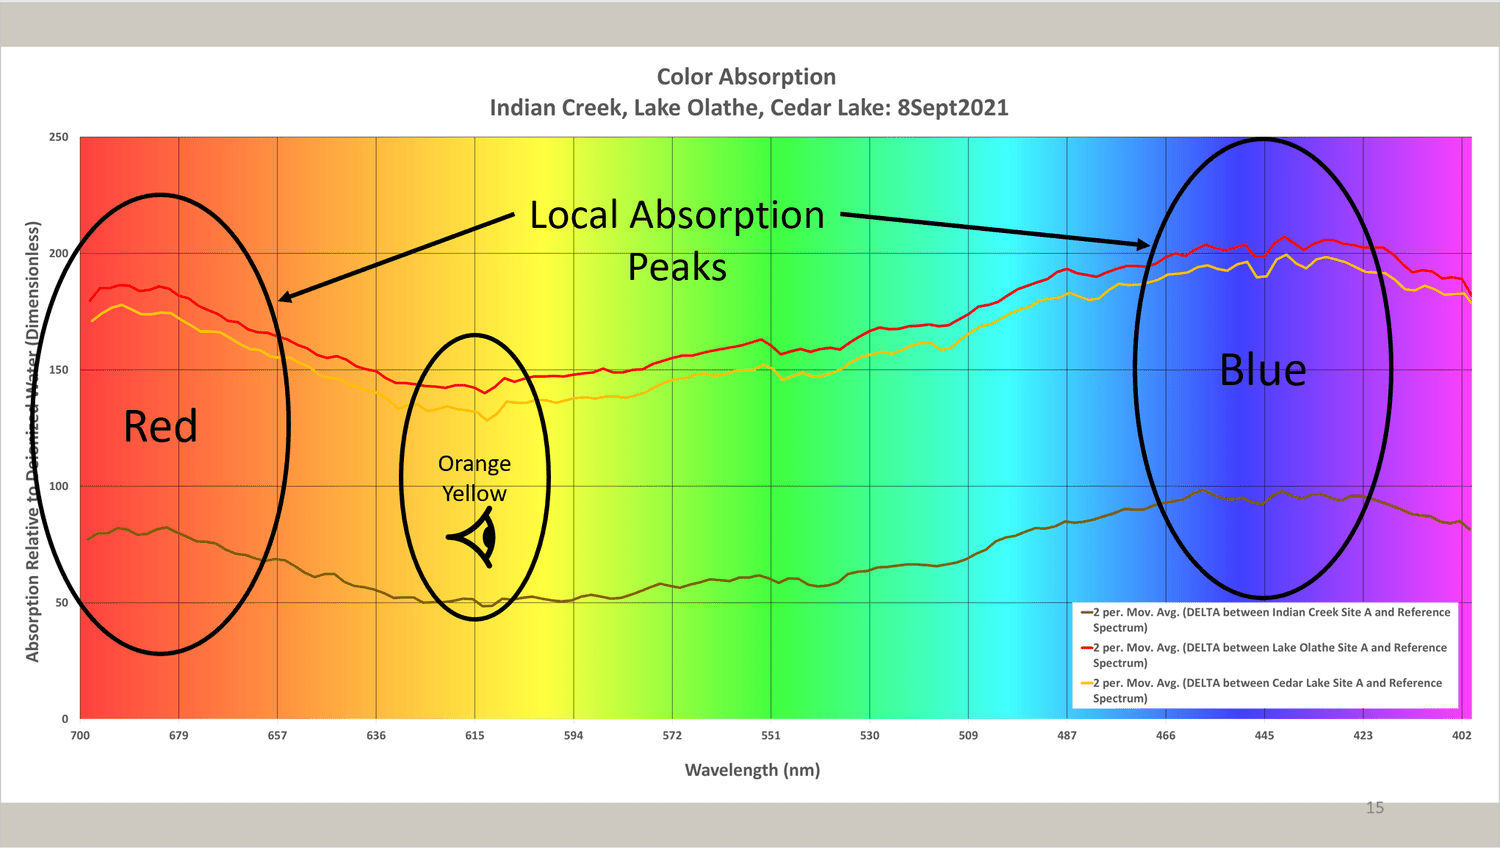
An example of the wavelength-by-wavelength plot produced from water samples. I interpreted the highlighted peaks as stronger losses of red and blue light, with weaker losses in the orange-yellow region. That pattern suggested an orange-yellow appearance for the sample. The graph compares the optical response with a reference; it was part of an exploratory study.
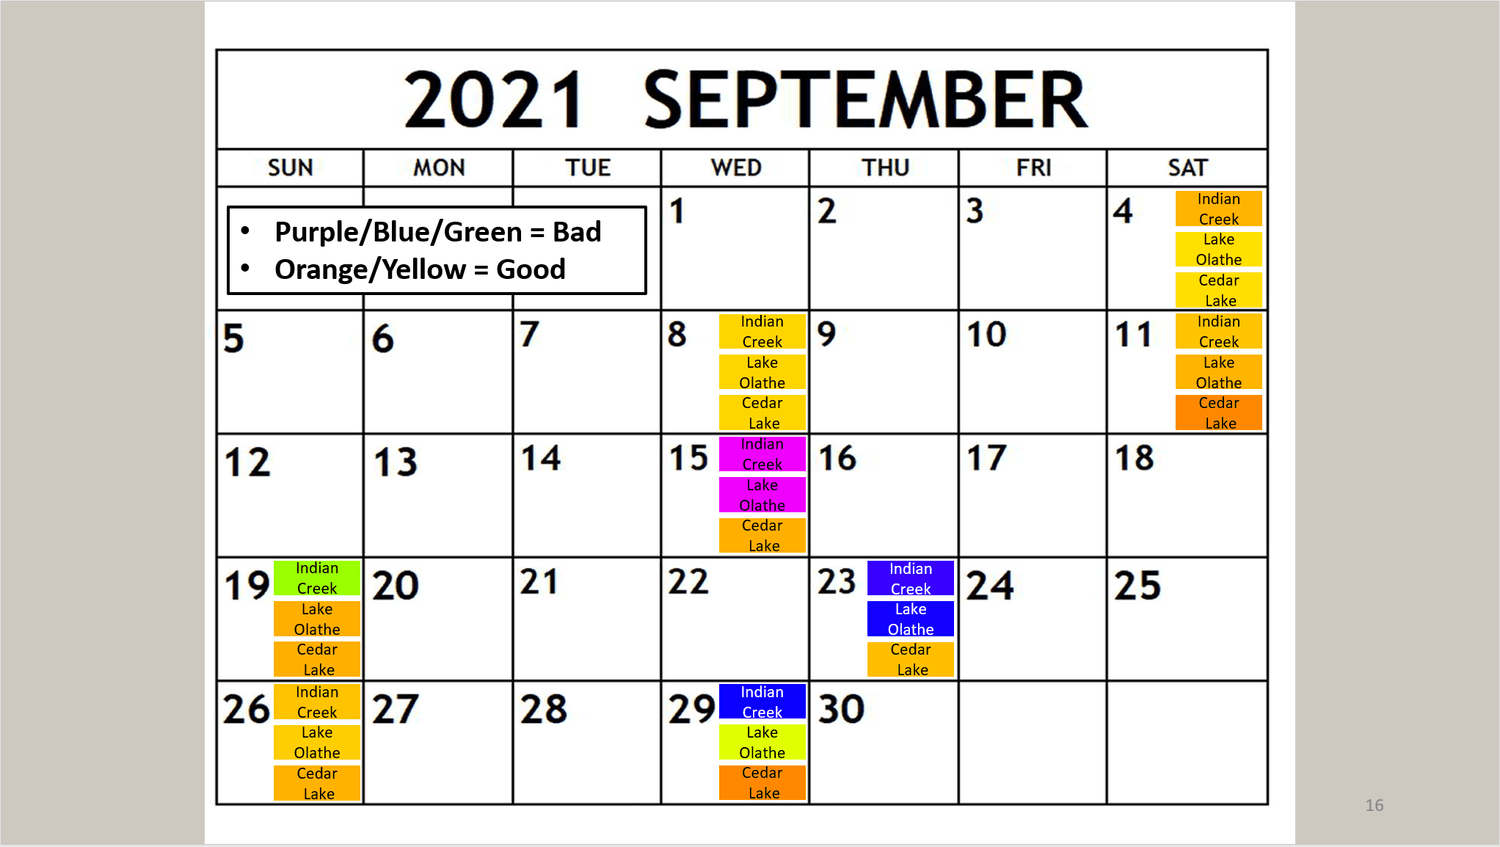
A sampling calendar from a monthlong study at three locations. I collected water in jars from the same places, brought the samples home, and ran them through the instrument. The calendar records changes in the optical patterns over time. Its ‘good’ and ‘bad’ labels reflect my early, unvalidated interpretation of those patterns.
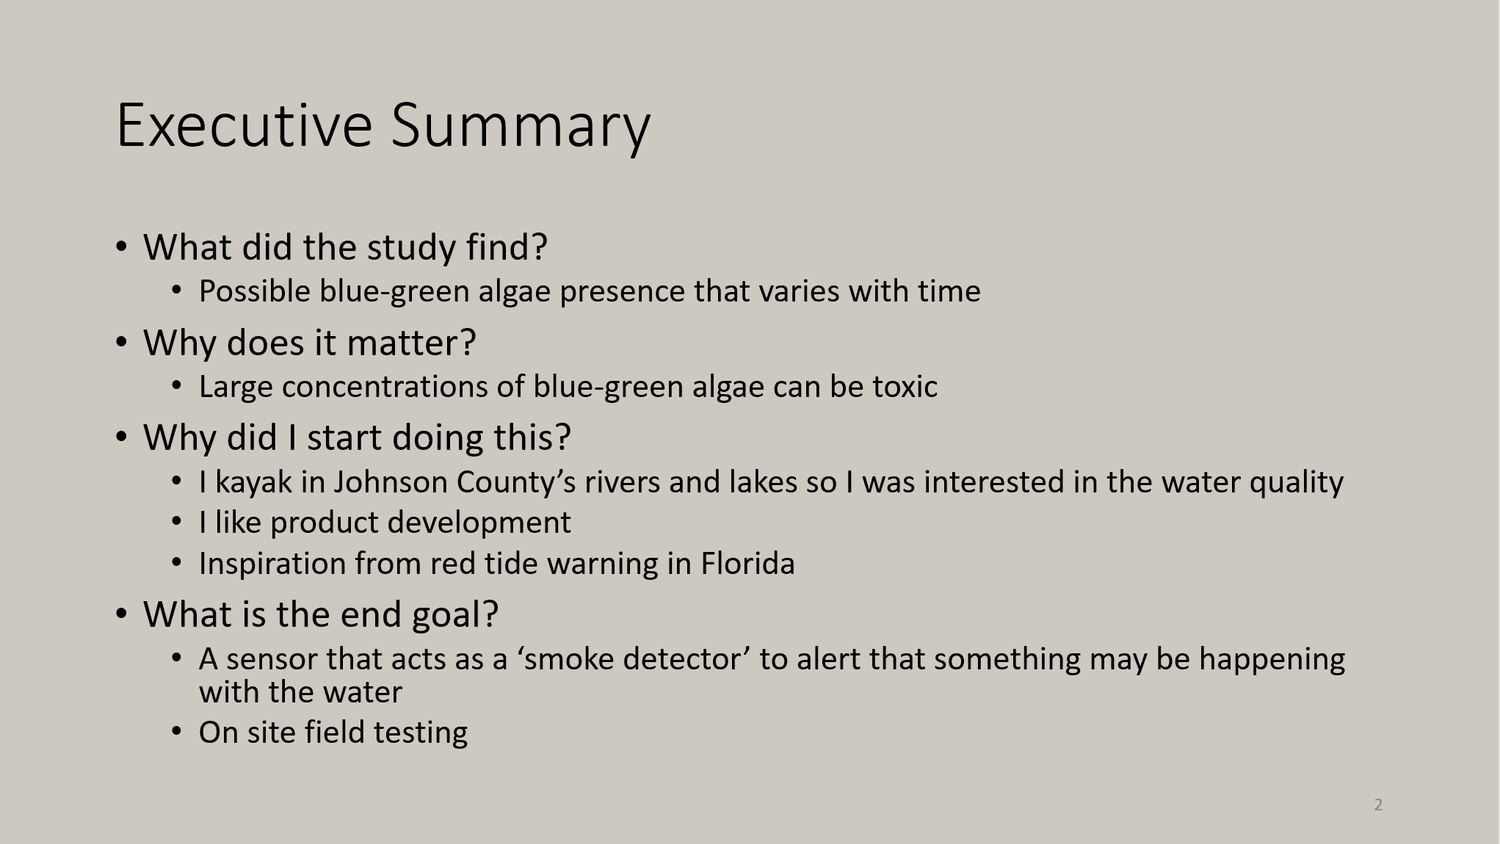
A summary of the exploratory study. I noticed a tendency toward blue-purple patterns on weekdays and orange-yellow patterns on weekends, and wondered whether activity during the working week might be related. A connection to pollution was a hypothesis that needed checking; the study did not establish a cause or confirm particular algae in the samples.
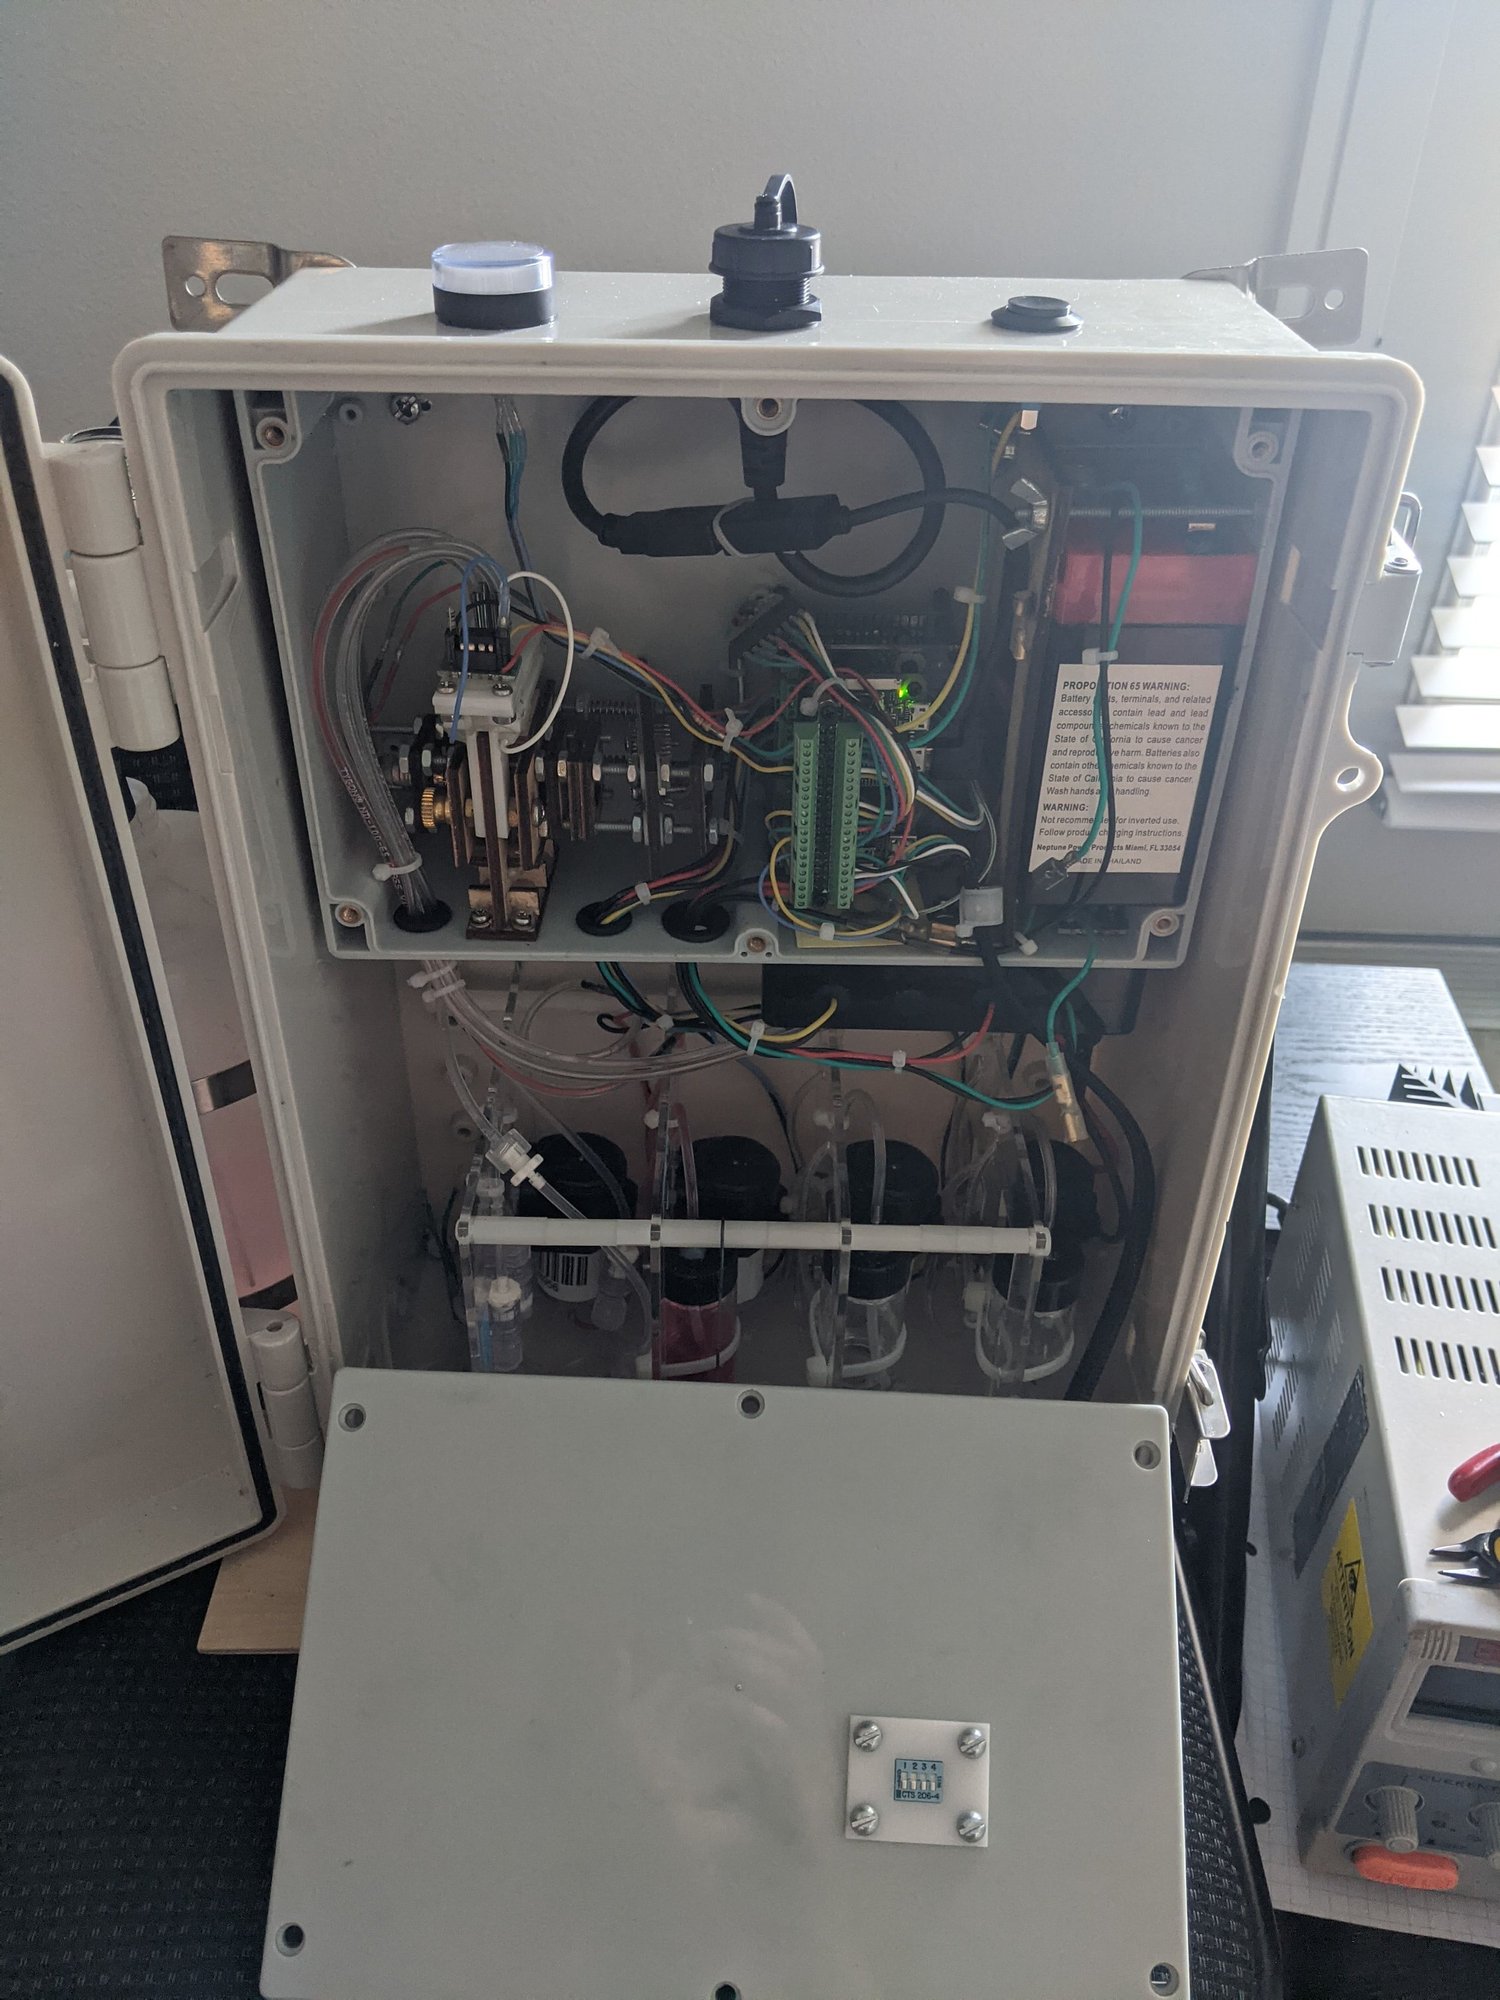
The sensor’s internal components, including the tungsten light source, water-sample slot, lens, diffraction grating, linear photodiode array, and battery. The optical components spread the transmitted light across a row of detectors so I could compare different parts of the spectrum.
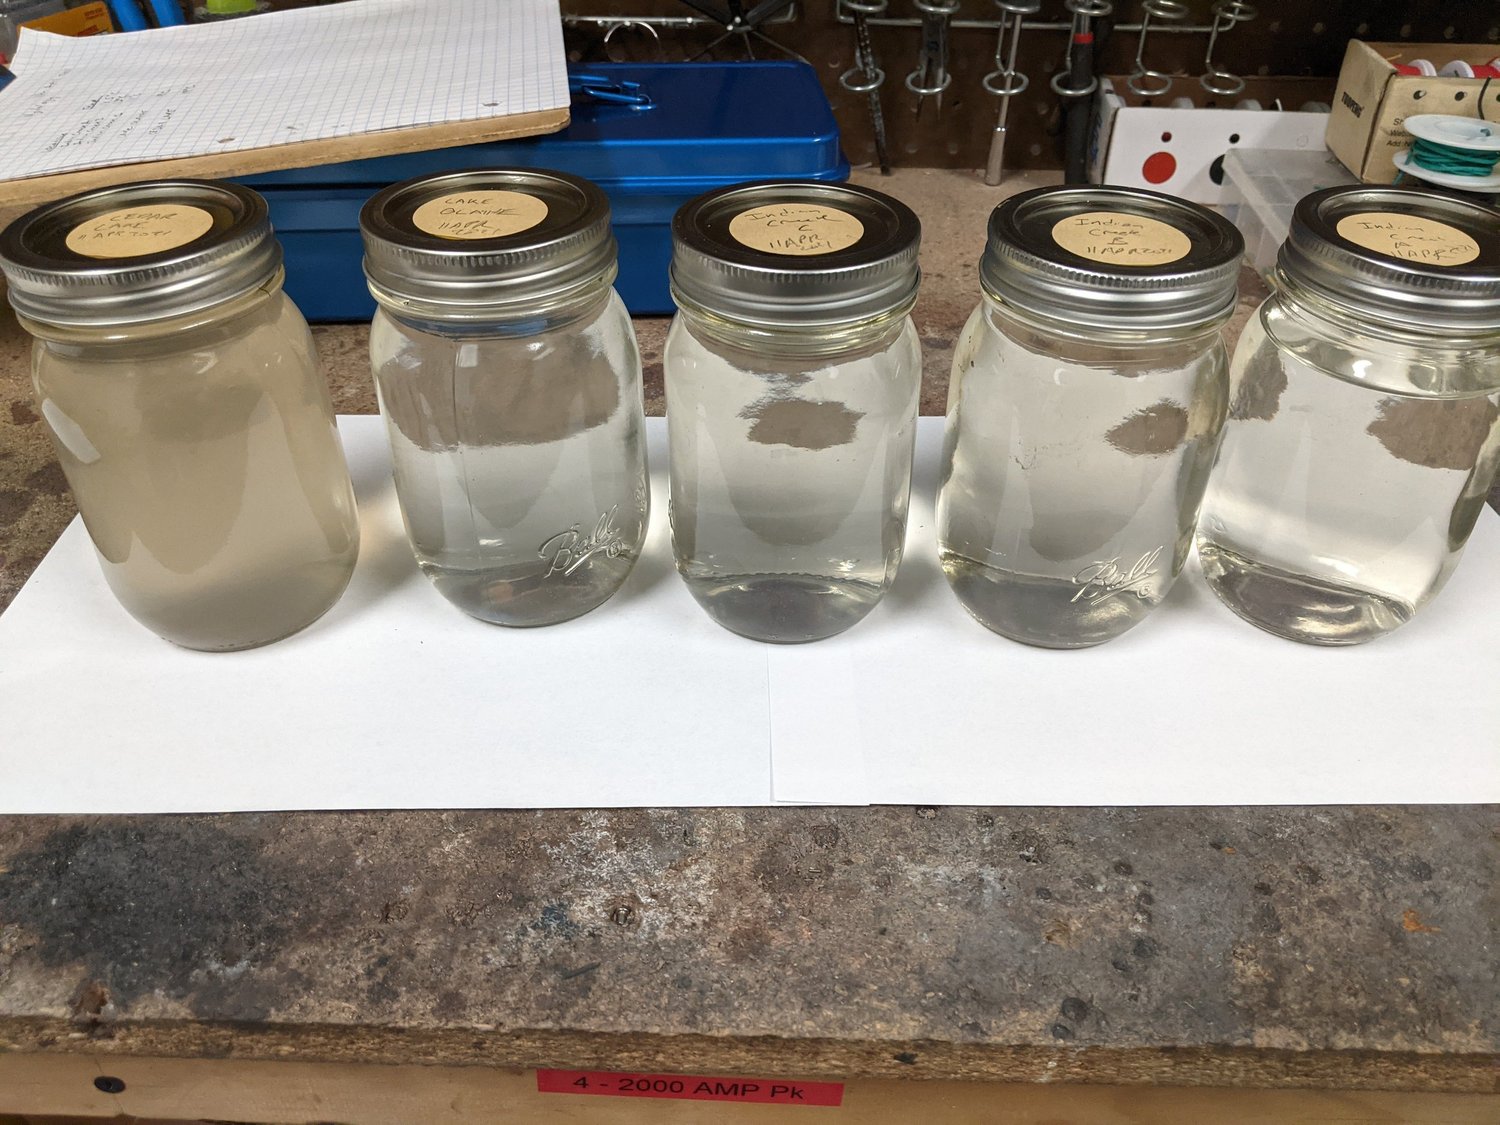
The jars used to bring samples back from the three collection locations. I tested the collected water at home and compared the resulting plots to follow changes between sites and sampling days.
Optical development and sample handling
Photos 310–313, 318
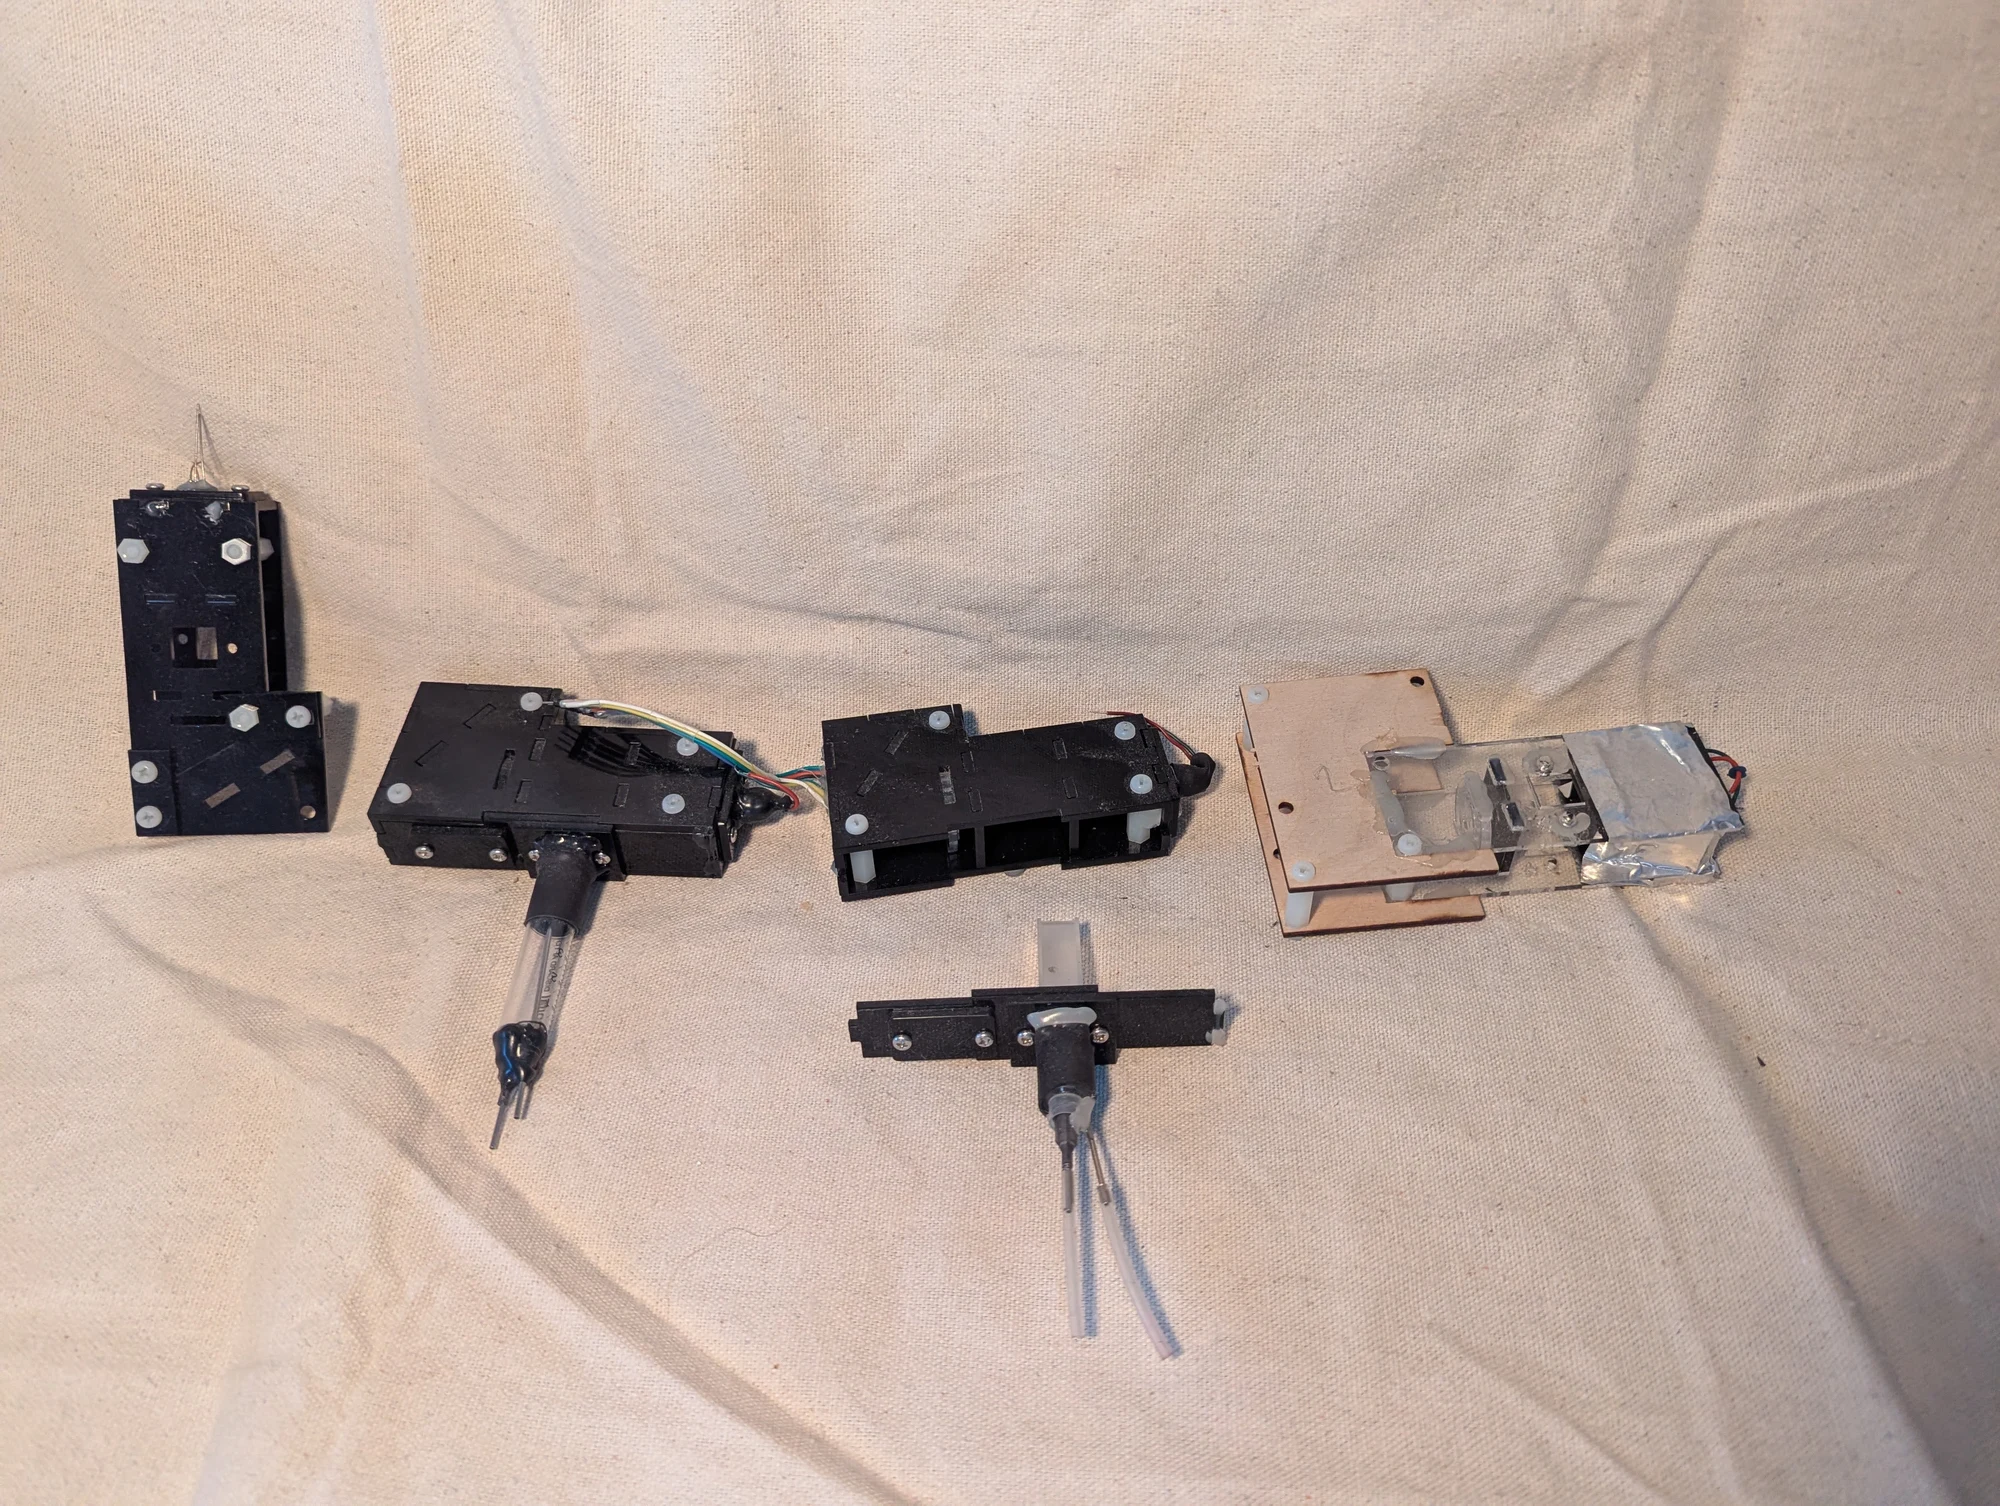
Several attempts at measuring which colors of light pass through a water sample and which are absorbed. I worked on the light source, detection, and repeatable automatic movement of samples. The designs used quartz cuvettes, small optical sample cells, a tungsten lamp, a diffraction grating to separate the colors, and a linear photodiode array, a row of light-sensitive detectors.
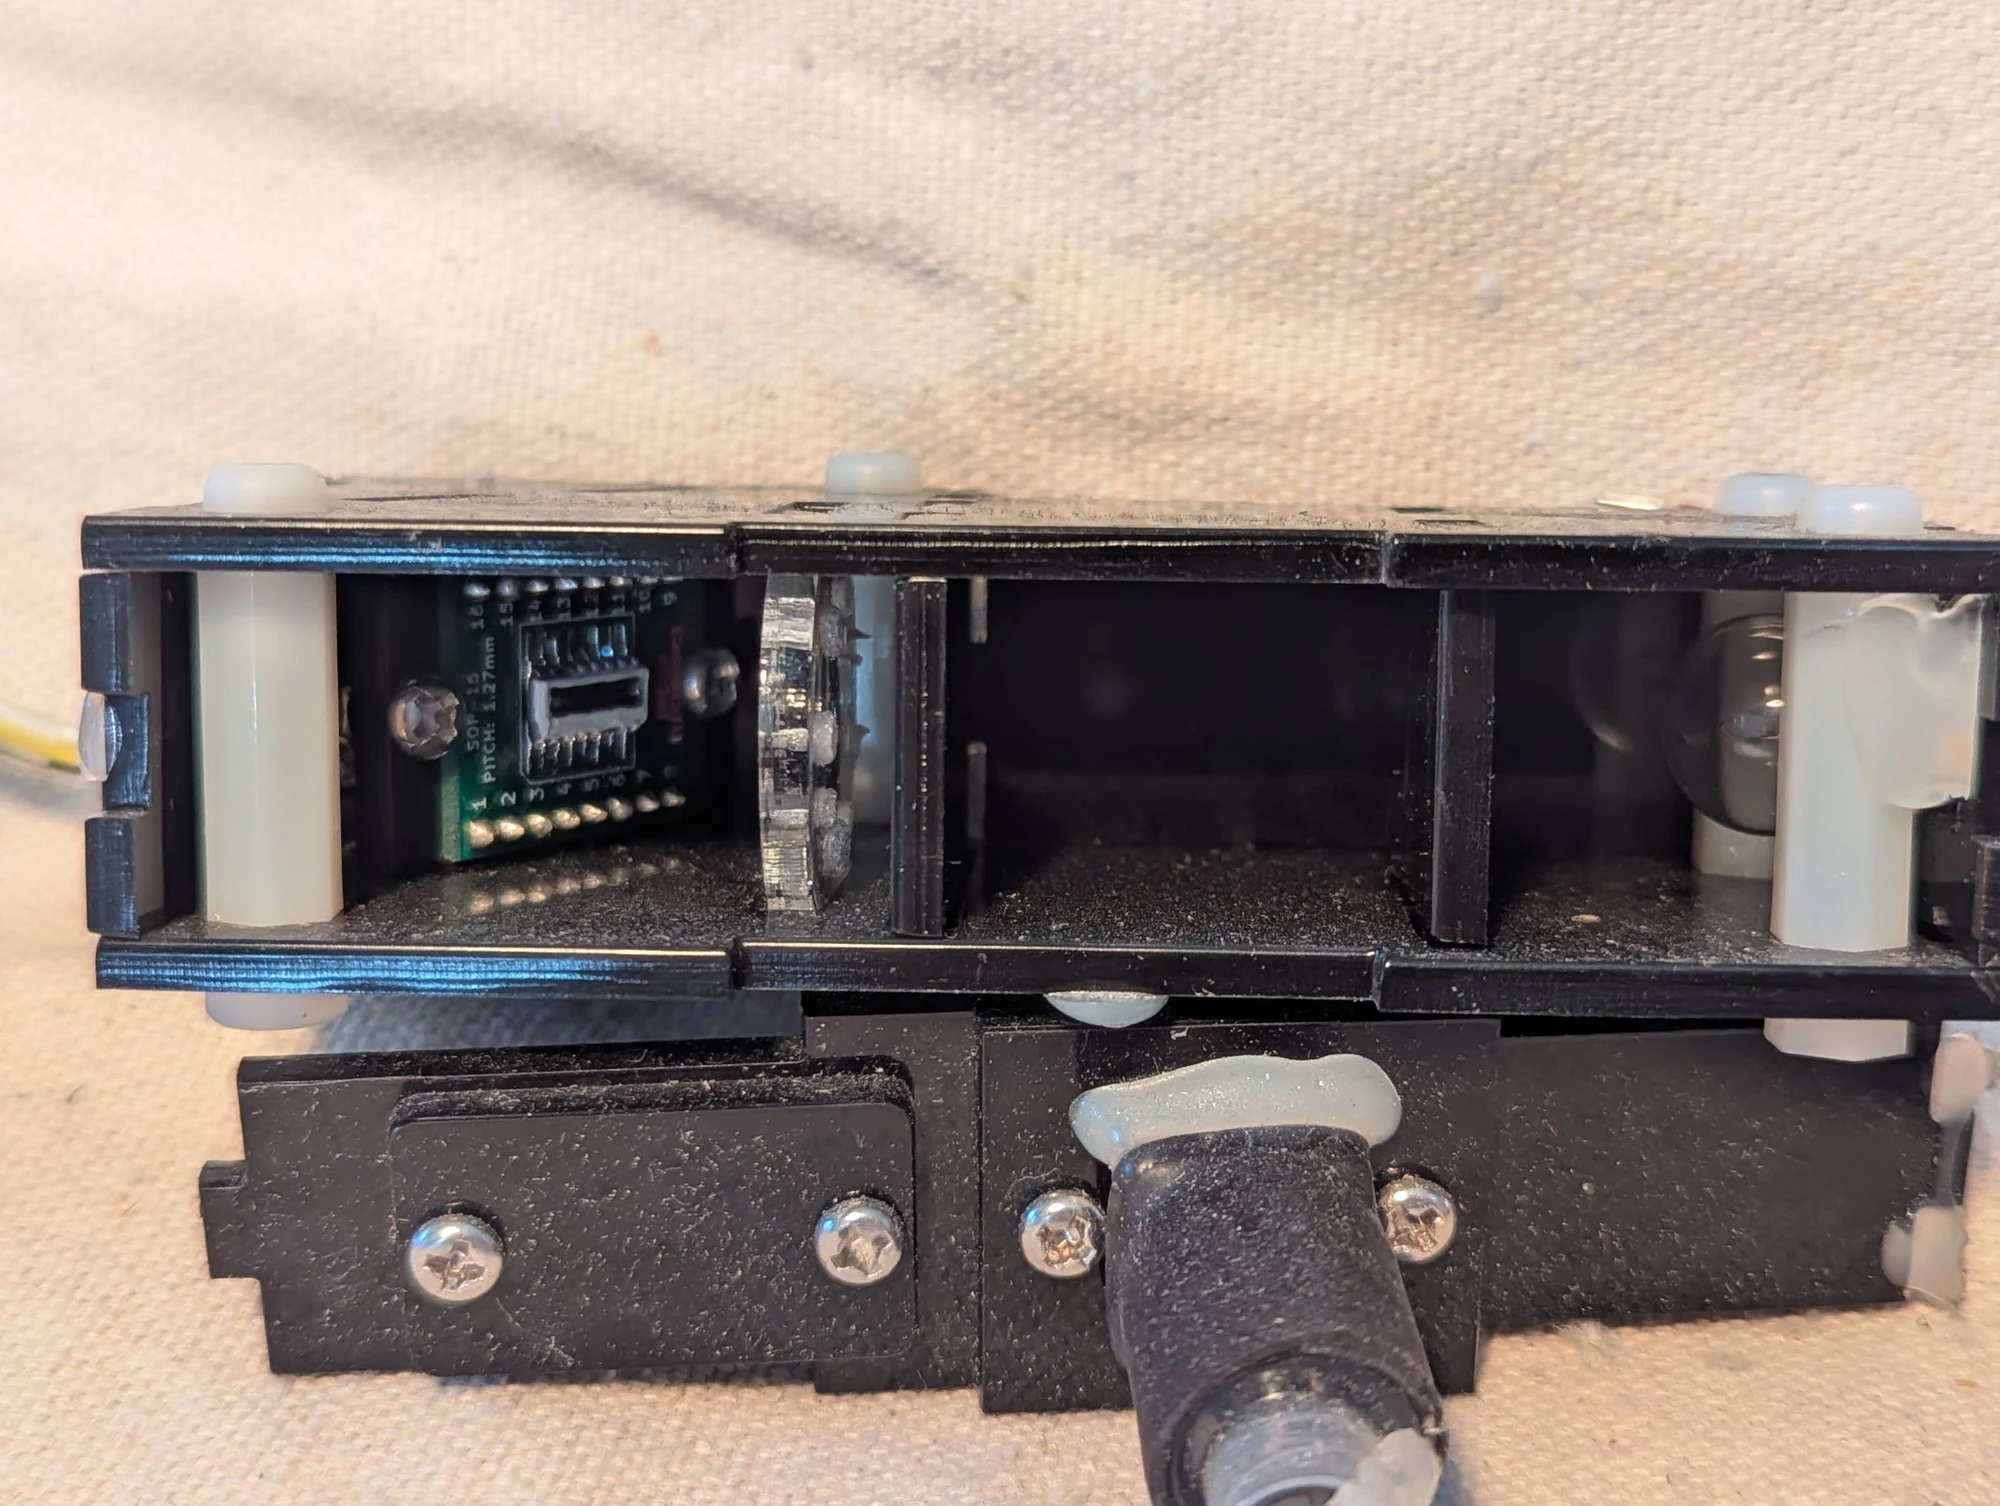
An opened prototype showing more of the optical layout. A diffraction grating separated the light by color, and a row of photodiodes was intended to measure the transmitted spectrum, revealing which parts of the light were absorbed by the water sample.
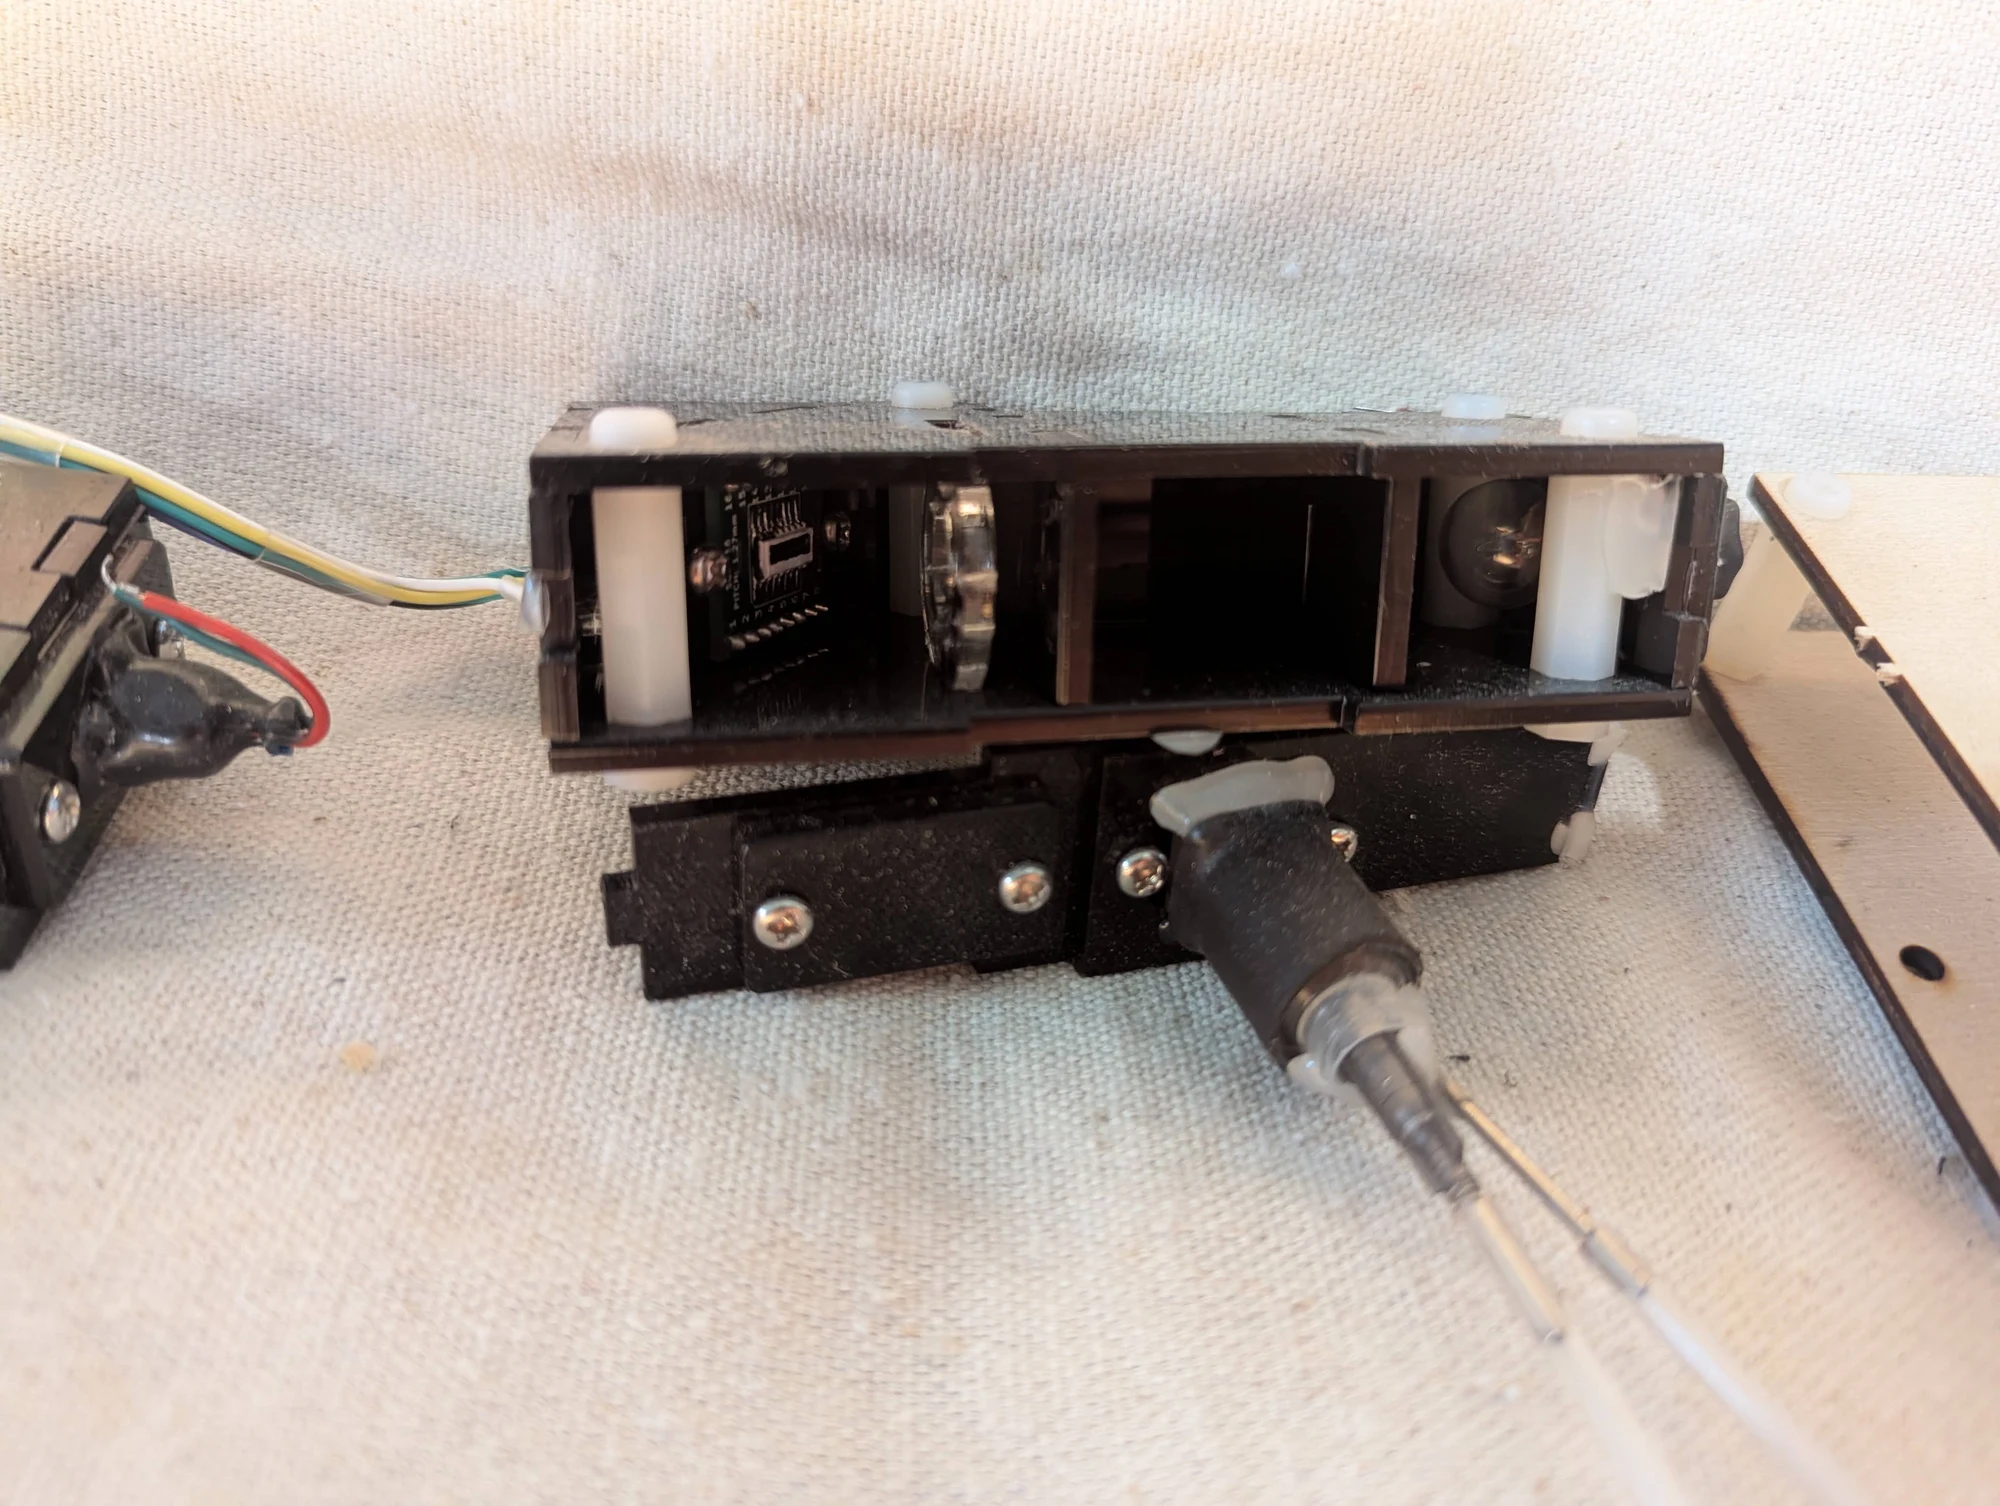
Another view of the water-sample measurement prototype. The project brought together illumination, optical detection, and ways to move samples through the instrument repeatedly.
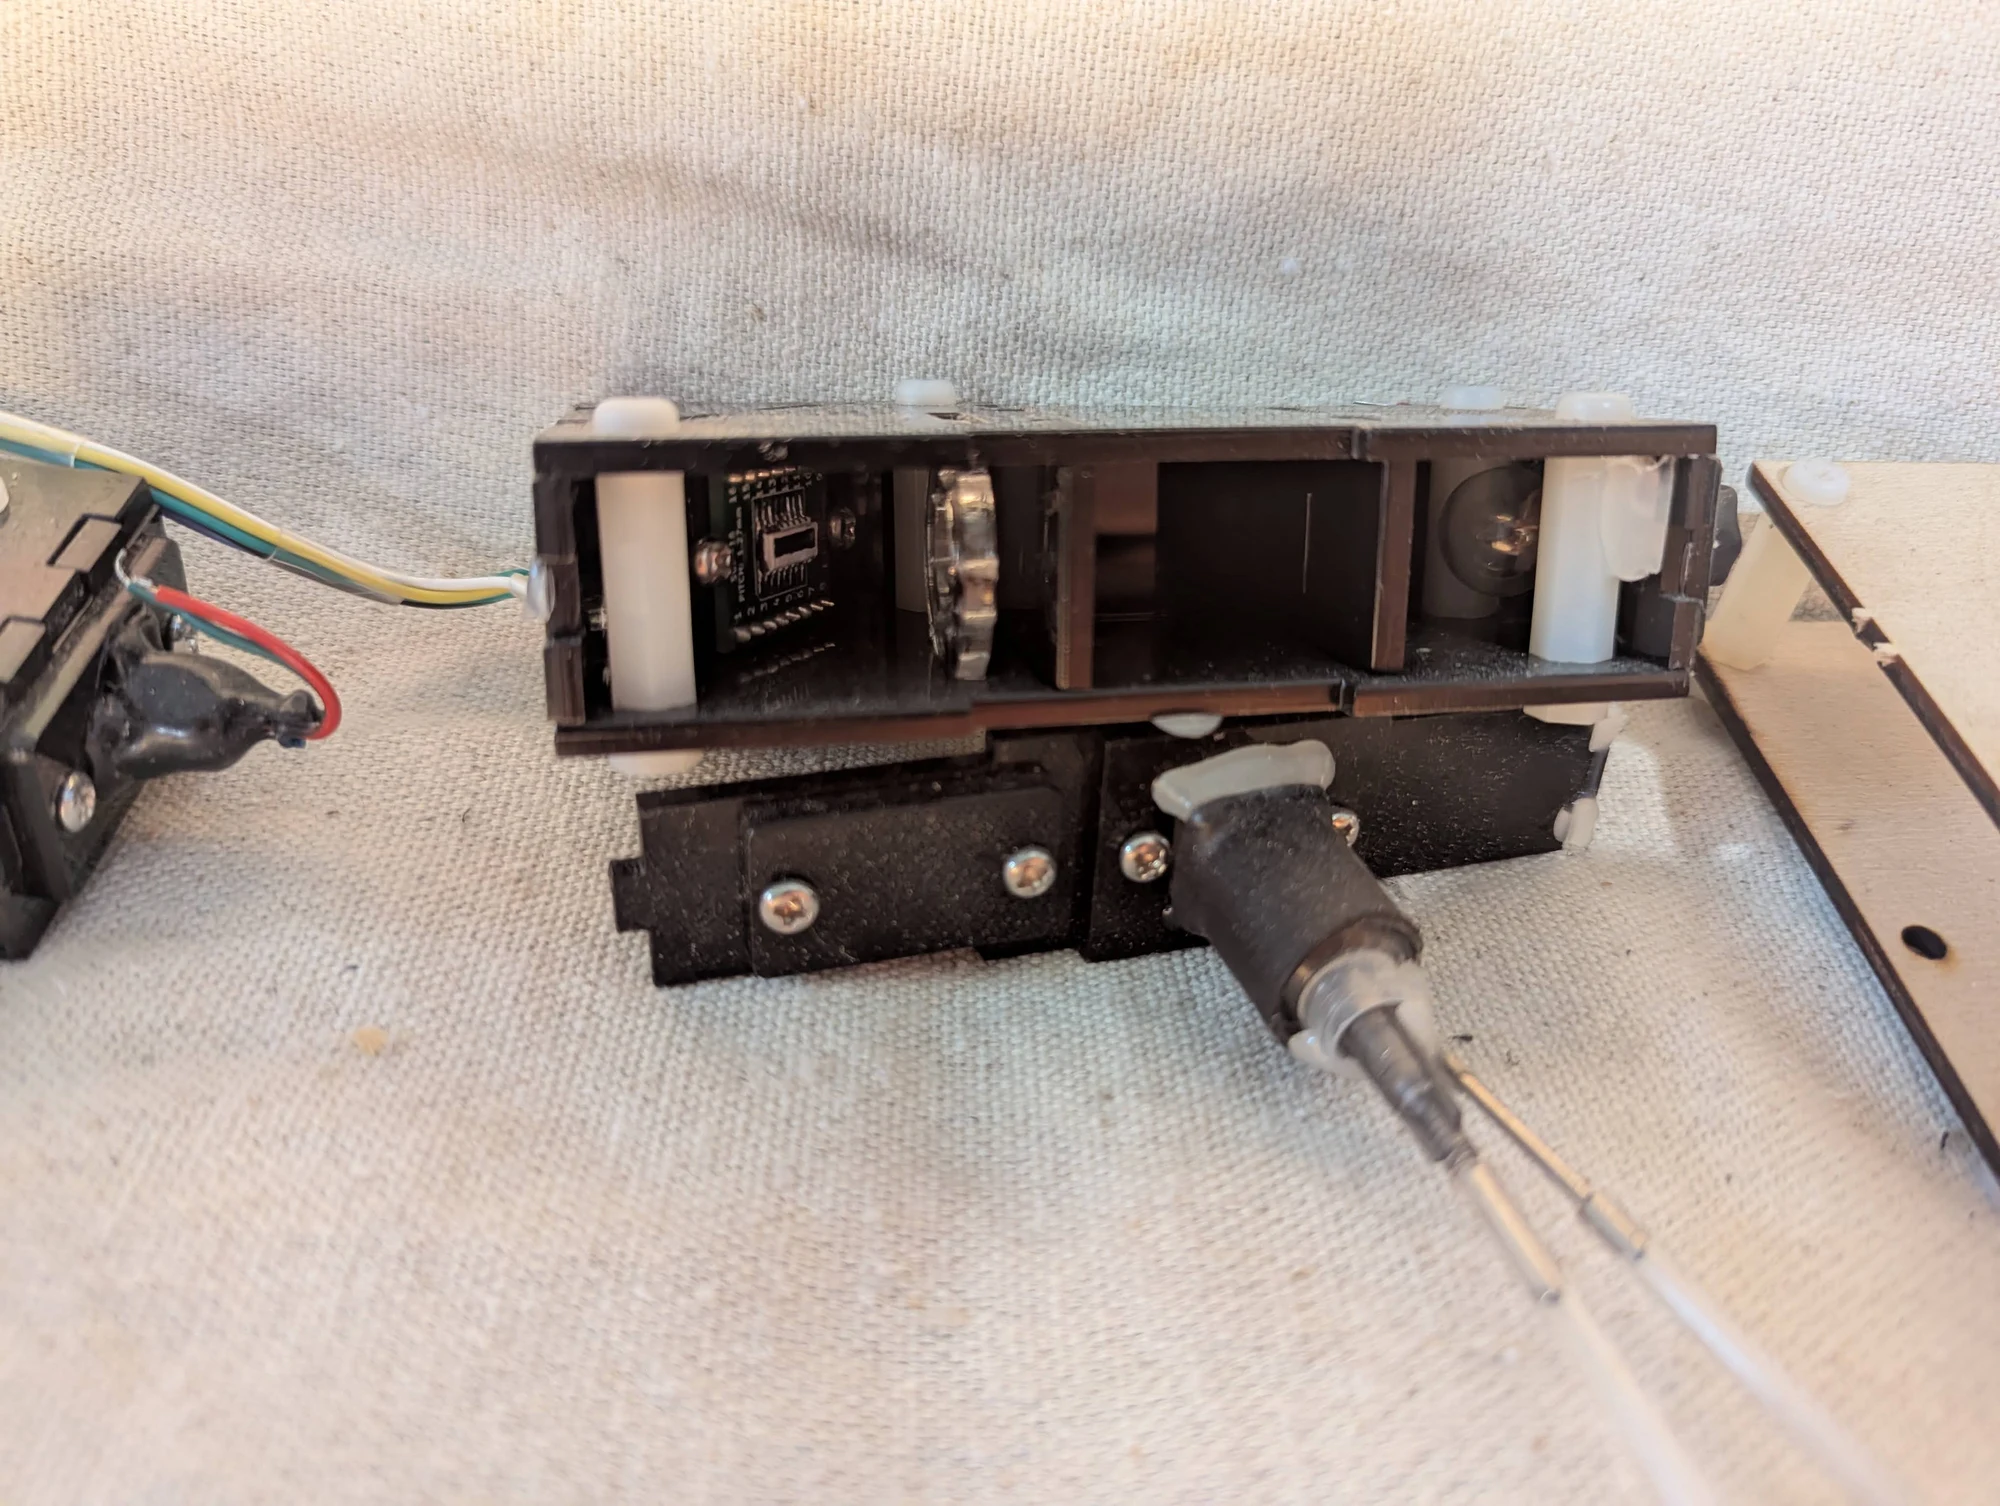
A further angle on the optical measurement assembly, showing the arrangement of parts used to investigate light transmission through water samples.
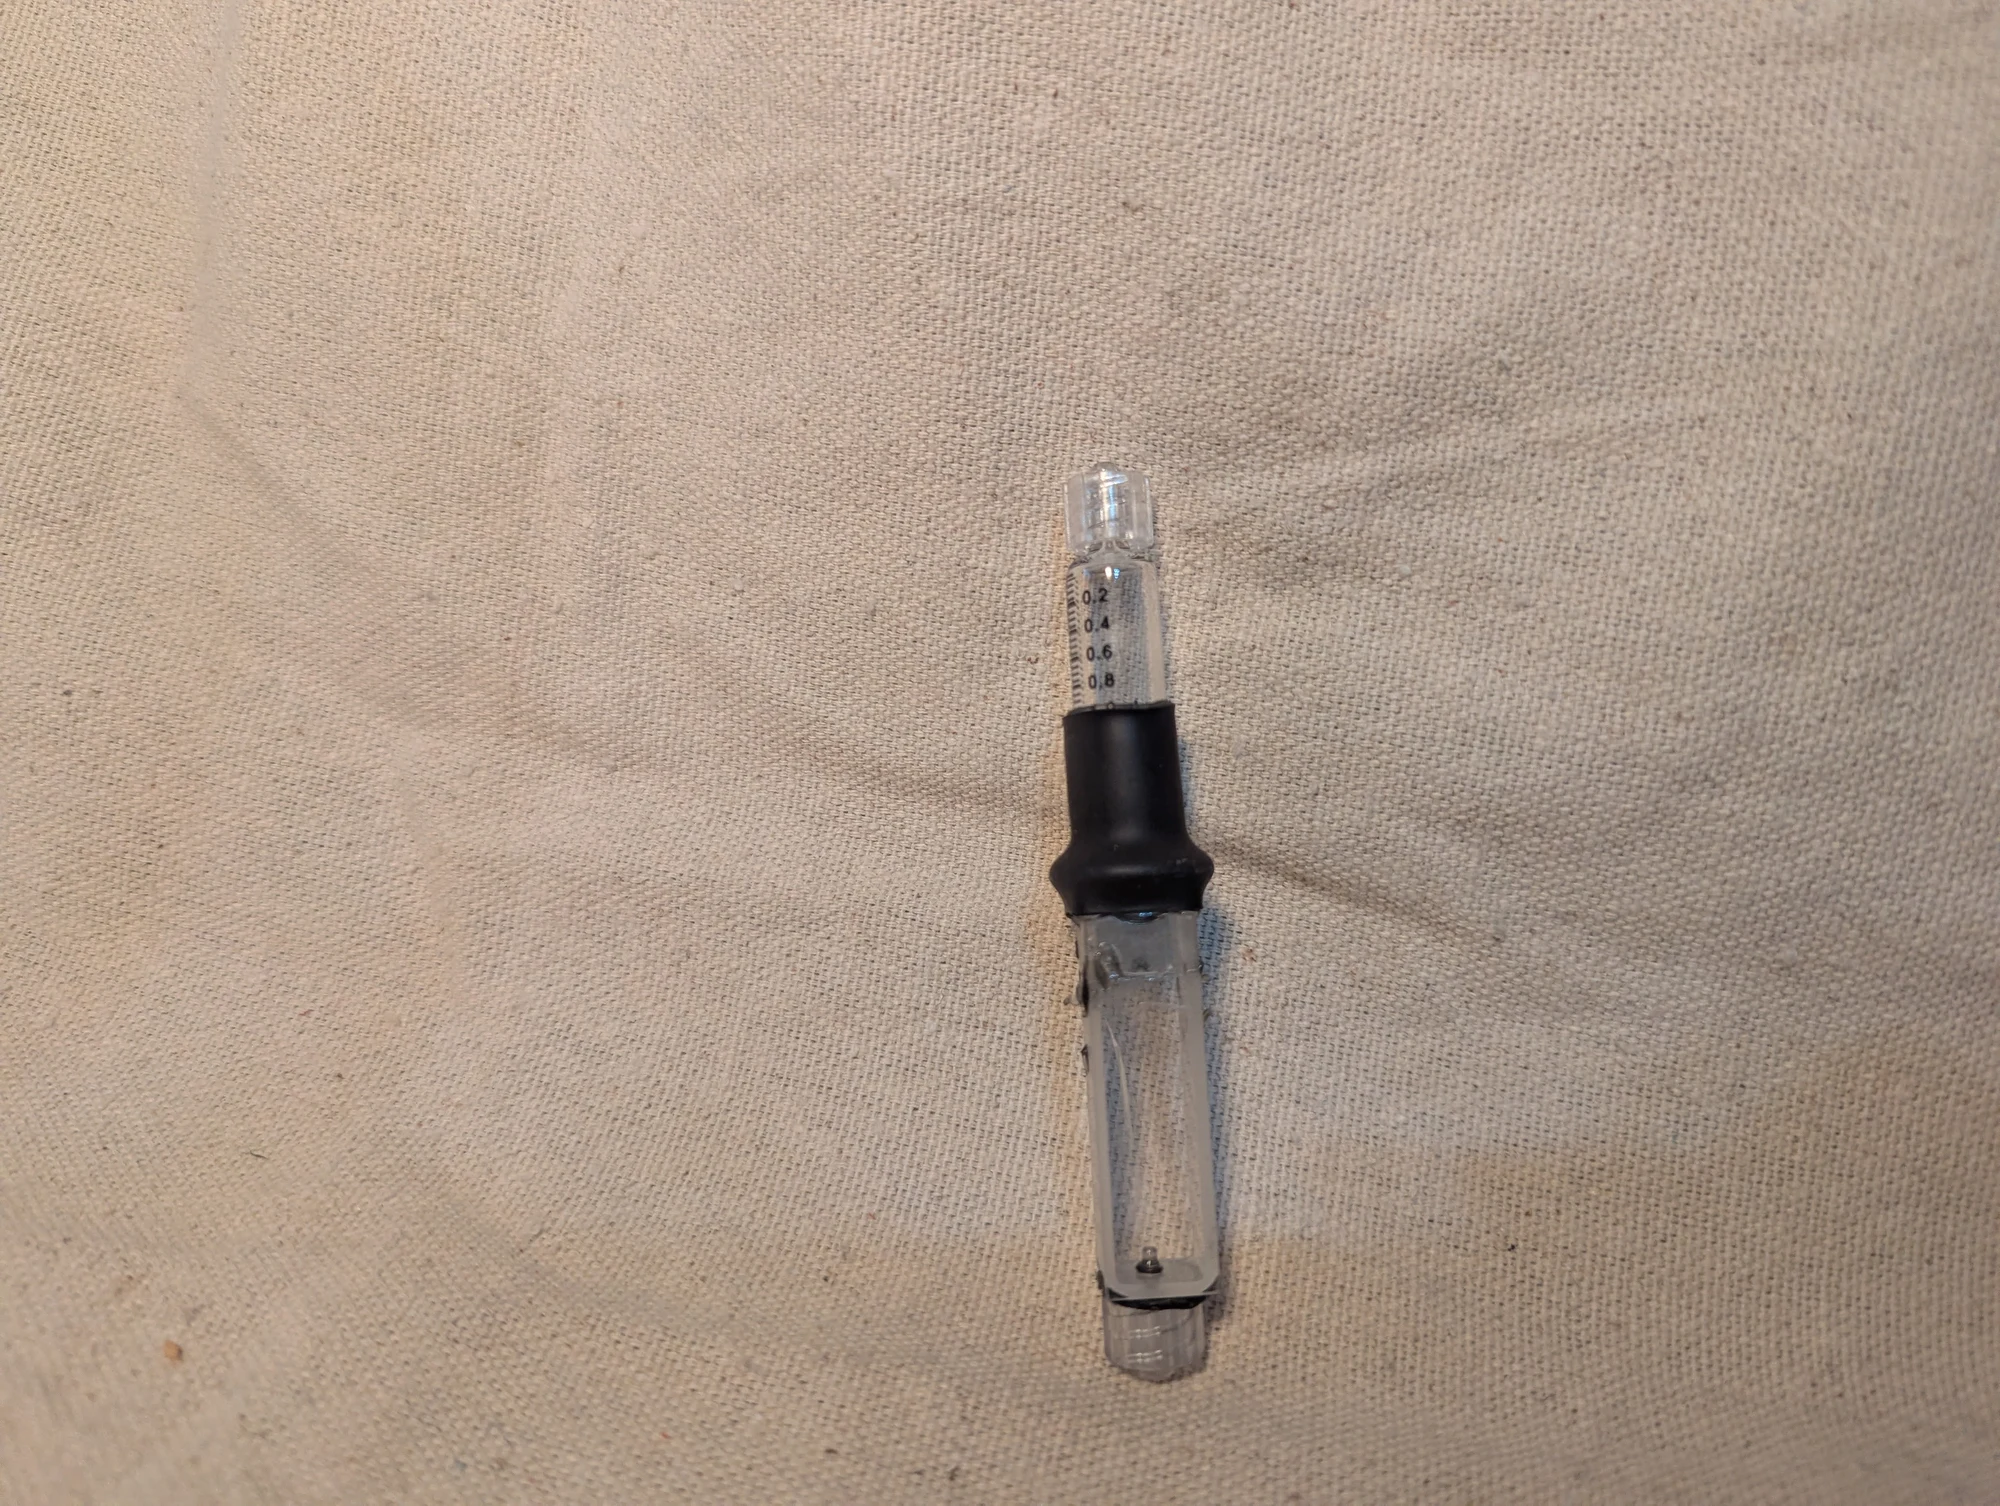
A syringe attached to an optical cuvette, the small transparent cell that holds a water sample for light measurements. This was part of the water-spectroscopy project. I do not recall whether this particular cuvette was glass or quartz.
Local drainage observations
Photos 359–360
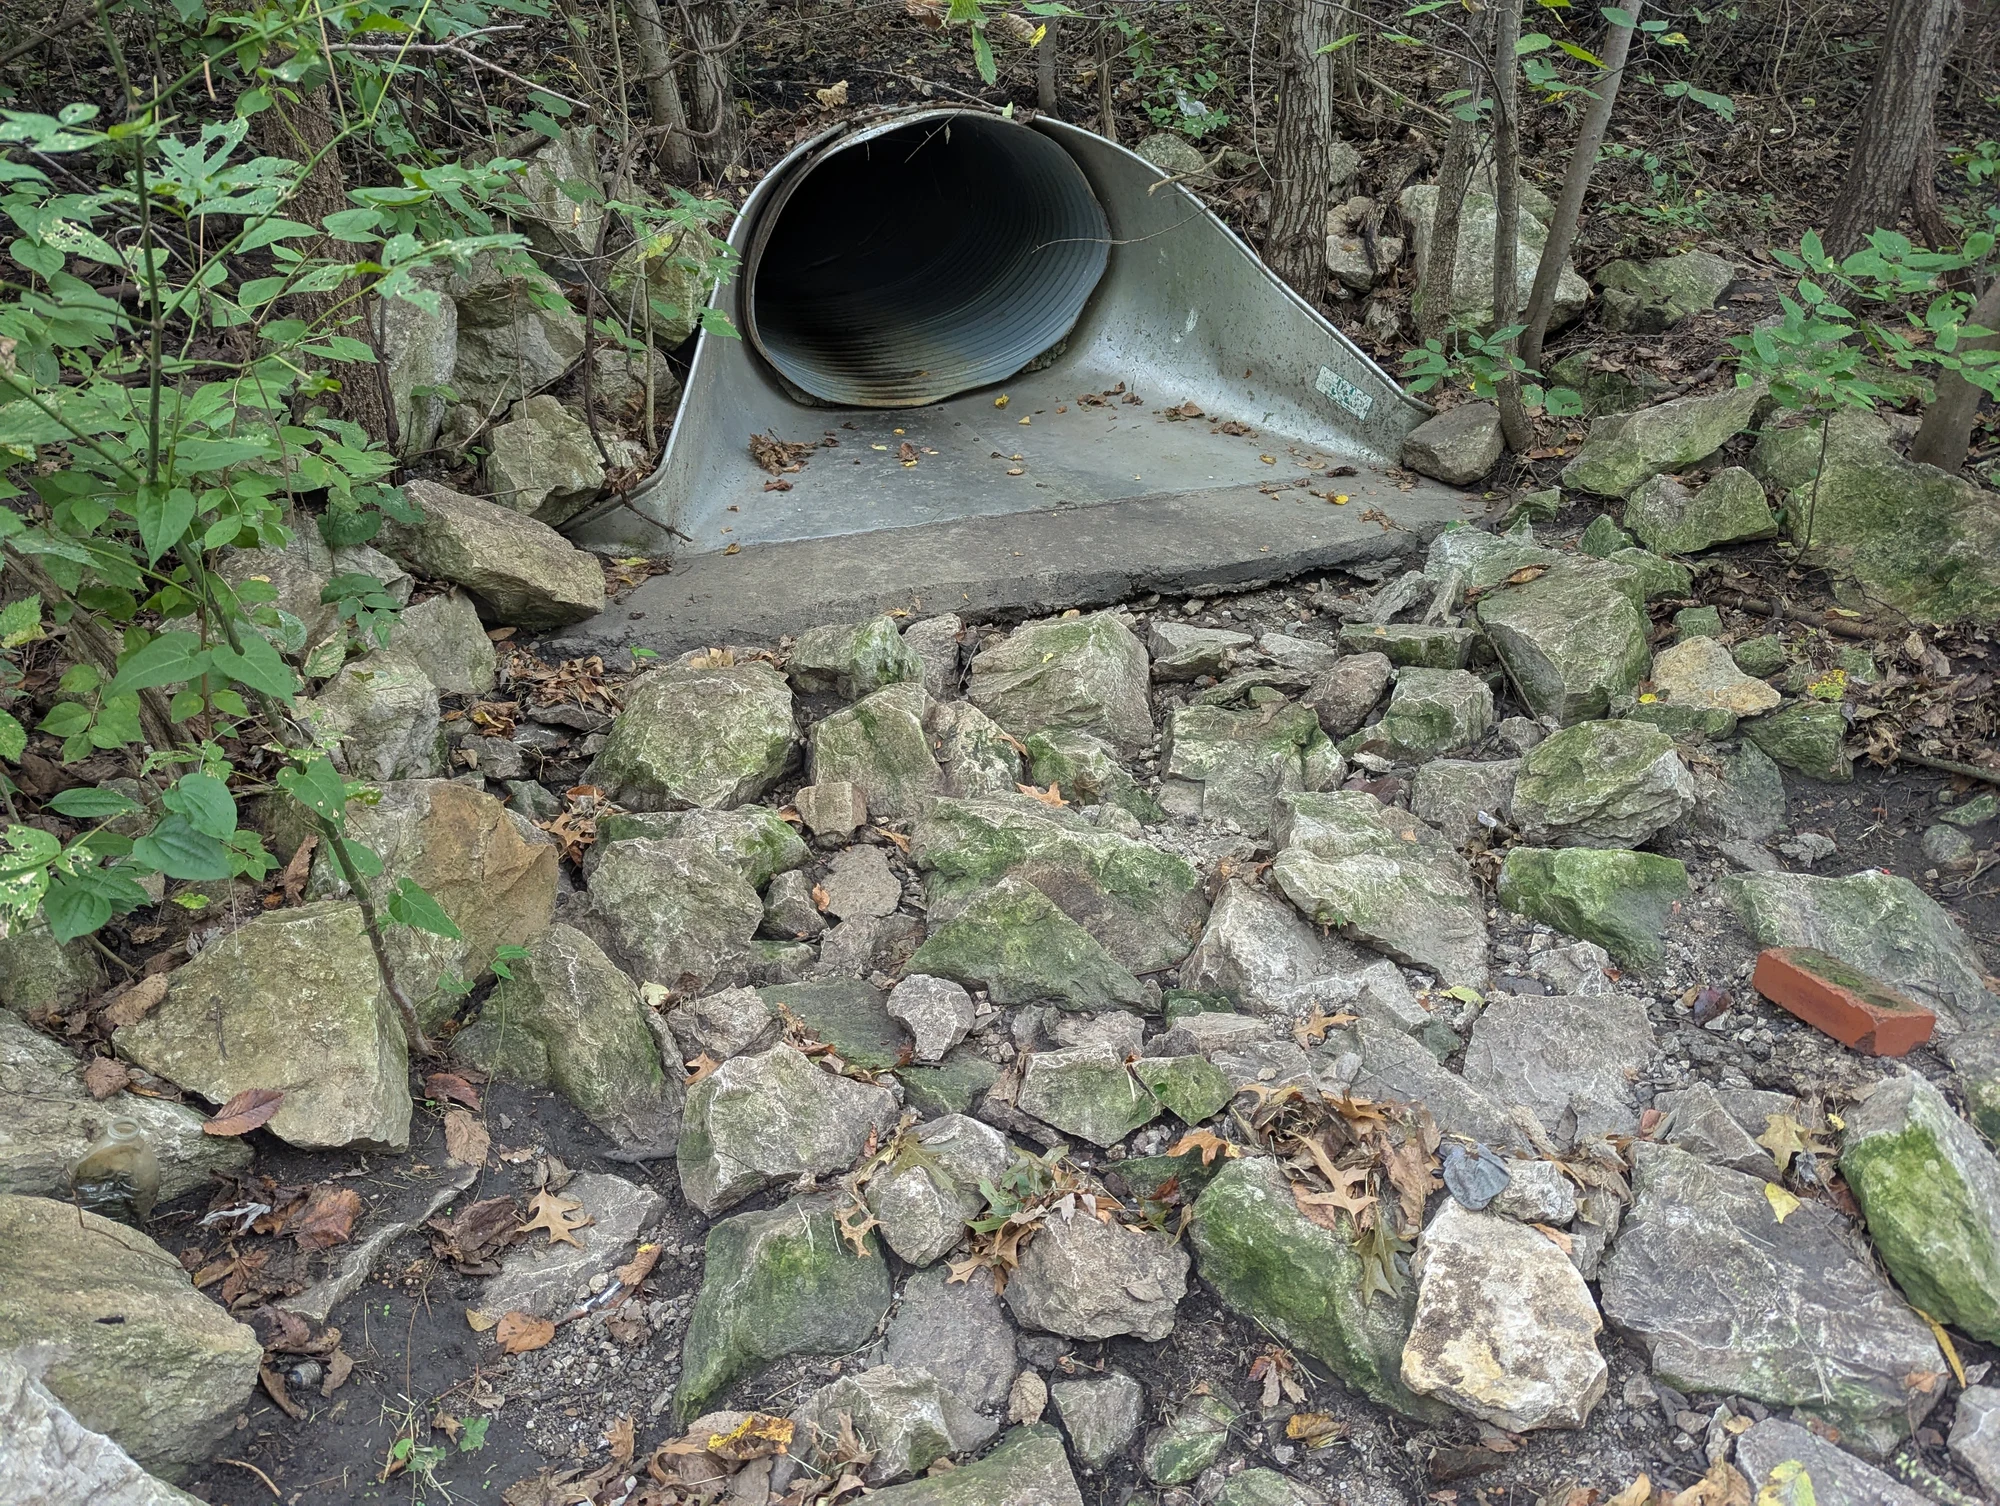
A photograph of a local storm-drain outlet and its surroundings.
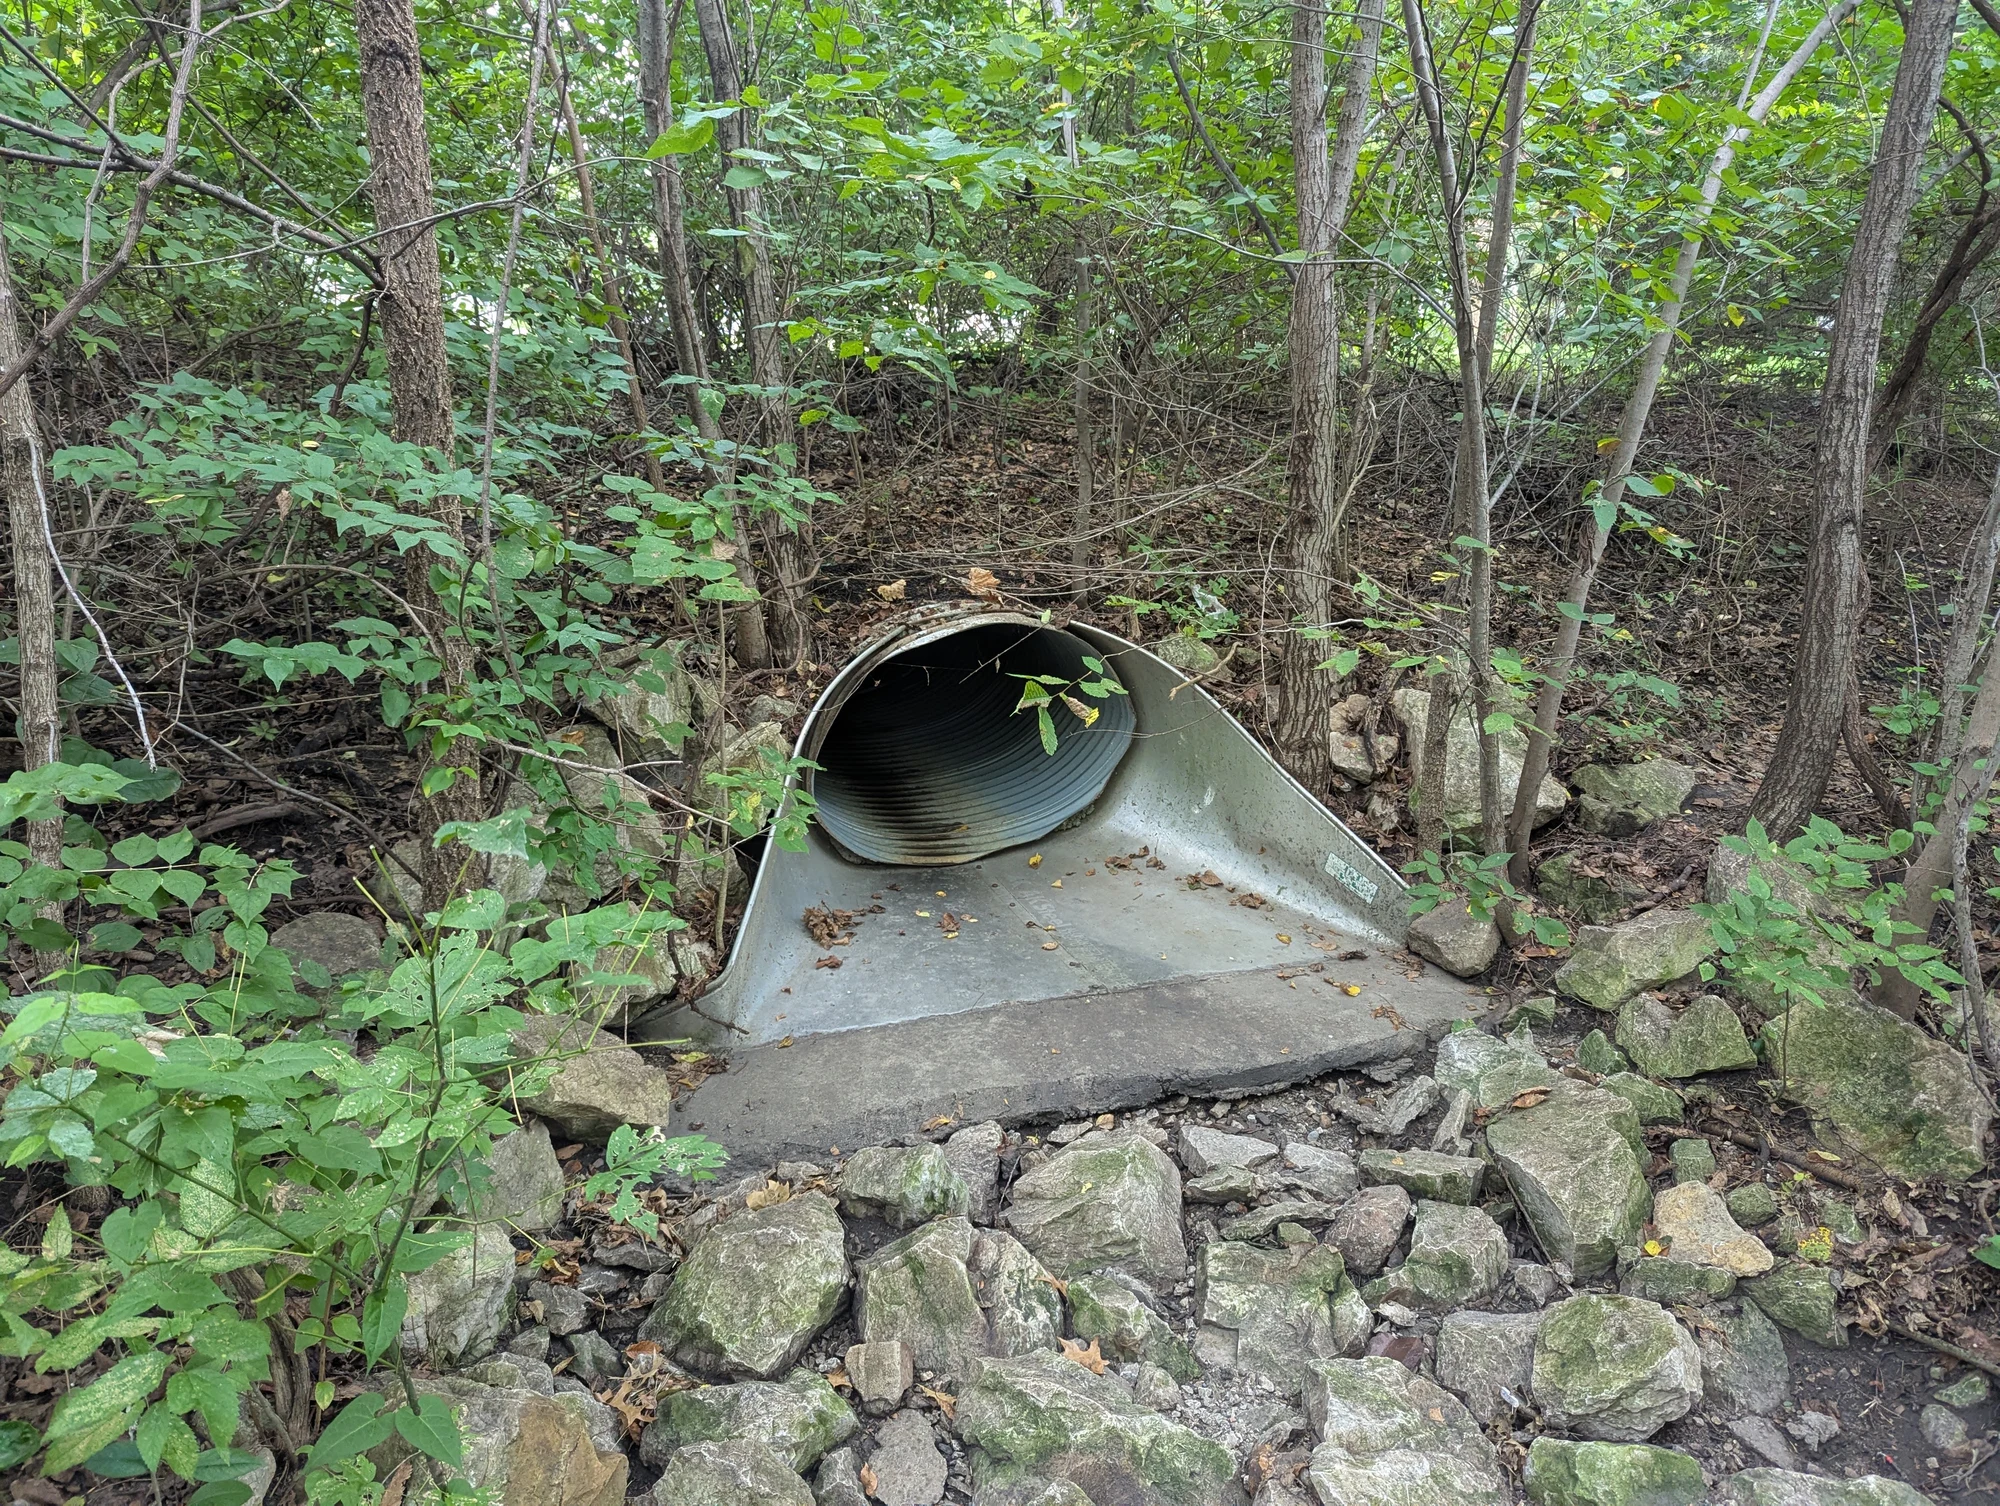
A second view of the storm-drain outlet.